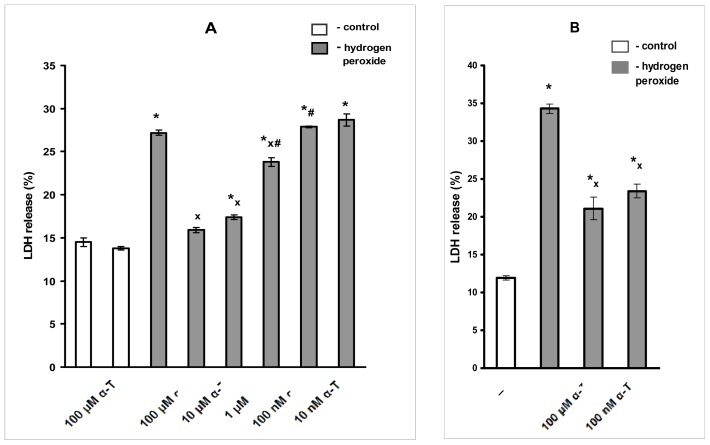
Figure 3.
The figure shows the effects of pre-incubation with α-T for 0.5 and 18 h prior to PC12 cell exposure to 1 mM H2O2 for 3 h. (A) Pre-incubation with α-T at various concentrations for 0.5 h; (B) Pre-incubation with 100 nM and 100 μM α-T for 18 h. In this figure, the results of one typical experiment (from five experiments made) are presented as means ± SEM of 2–3 parallel determinations. The differences are significant by one-way ANOVA followed by Tukey’s multiple comparison test: * as compared to control values, p < 0.01; x as compared to the effect of H2O2 alone, p < 0.05; # as compared to the effect of α-T at all higher concentrations, p < 0.01. The data obtained provide evidence that pre-incubation with nanomolar α-T for 0.5 h prior to cell exposure to 1 mM H2O2 is not protective against H2O2-induced toxicity, while micromolar α-T is protective (A). However, if PC12 cells are pre-incubated with 100 nM or 100 μM α-T for 18 h and then exposed to 1 mM H2O2 (B) the protective effect of α-T in both concentrations is similar and significant (B).

