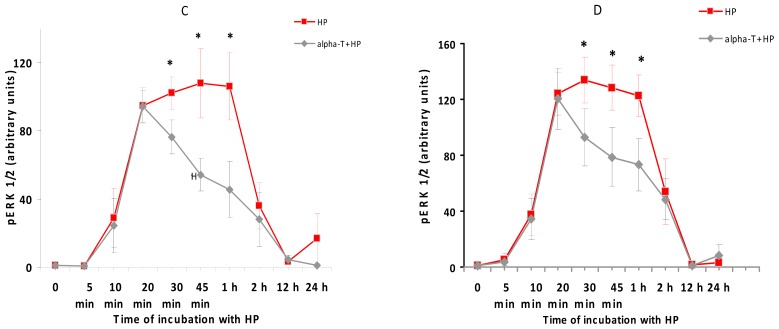
Figure 9.
The figure shows the effect of hydrogen peroxide and pre-incubation with α-T on the activity (pERK 1/2 level) and expression of ERK 1/2 in PC12 cells. PC12 cells were pre-incubated with 100 nM and 100 μM α-T (or without it) for 18 h and then exposed to 0.3 mM H2O2. The results of immunoblotting obtained in one typical experiment (from five experiments made) are shown in (A,B), (A) 100 nM α-T; (B) 100 μM α-T. The results of five experiments are shown in (C,D) as means ± SEM; (C) 100 nM α-T; (D) 100 μM α-T. Red lines with square data points show effect of H2O2 alone, black lines with diamond data points show the effect of H2O2 after pre-incubation with α-T. In (C,D): HP is an abbreviation for hydrogen peroxide. alpha-T is an abbreviation for α-tocopherol * the differences are significant according to Students’ paired t test, as compared to the level of pERK 1/2 in the PC12 cells exposed to α-T and H2O2, p < 0.05.


