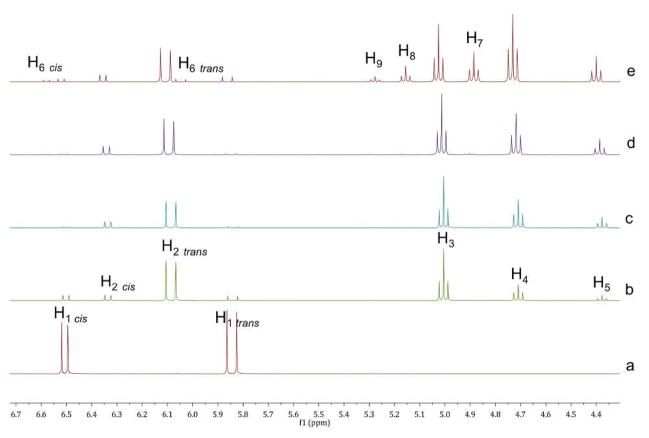
Figure 1.
1H NMR monitoring. (a) Partial spectra of 1a in DMSO-d6 and Et3N. (b) 5 minutes after the the addition of 2c. (c) 50 minutes after the addition of 2c. (d) 5 minutes after the addition of 2b. (e) 14 hours after the addition of 2b. The labels correspond to the H’s in Scheme 2.

