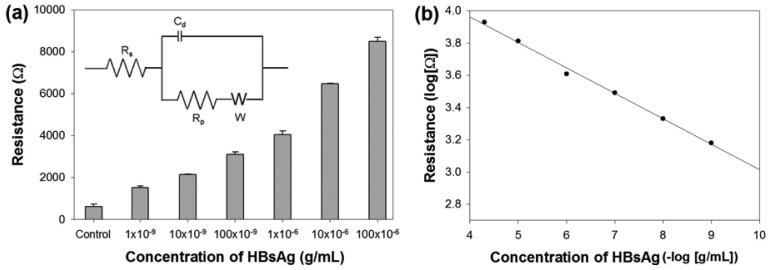
Figure 4.
(a) EIS detection of different concentrations of HBsAg. 10 μg/mL, 1 μg/mL, 100 ng/mL, 10 ng/mL and 1 ng/mL of HBsAg were detected with 10 μg/mL BSA as a negative control, respectively. Numerical data was fitted with circuit as shown in Figure 3(a) (Inset: an equivalent circuit representing each component at the interface and in the solution during an electrochemical reaction is shown for comparison with the physical components. Cd, double layer capacitor; Rp, polarization resistor; W, Warburg resistor; Rs, solution resistor). Error bars represent standard deviations from 5-time measurements. (b) Linear calibration curve into log scale of EIS data (R2 = 0.97).

