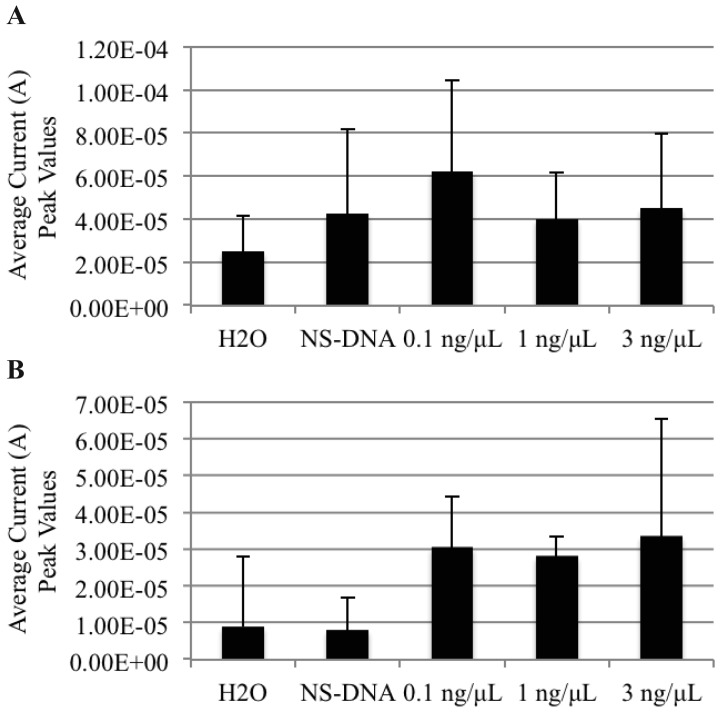
Figure 3.
Non-PCR amplified S. enteritidis genomic DNAt can be detected from a mixed DNA culture using the AuNP-DNA biosensor. Graphs represent the average differential current peak values vs. DNAt concentration. (A) TRIzol® extracted genomic DNAt from PBC and (B) phenol/ethanol extracted genomic DNAt from PBC. H2O, blank control; NS-DNA, non-specific PCR amplified B. anthracis DNAt (0.1 ng/μL) negative control; HCl, 1M hydrogen chloride. Graphs represent the average value of duplicate samples for each condition. Error bars represent the standard deviation of the mean.

