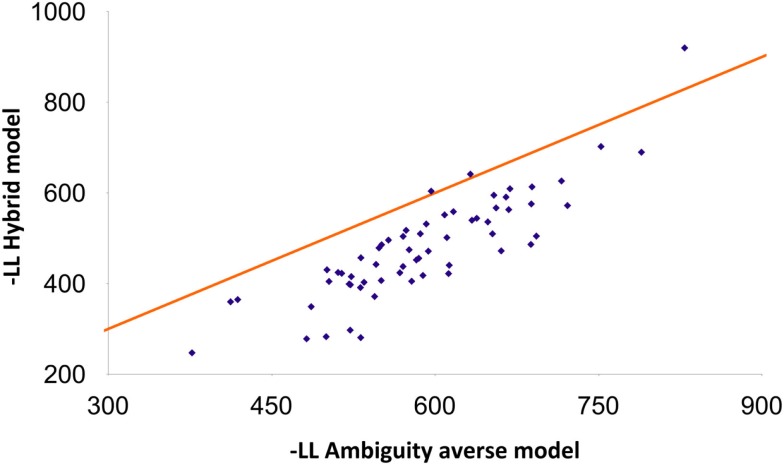
Figure 1.
Comparative fits of the ambiguity averse and hybrid models. The comparison of the fits is based on the negative log-likelihood (-LL) criterion. Each data point corresponds to one subject (500 samples on average per subject). The hybrid model fits better when the data point is below the 45° line.

