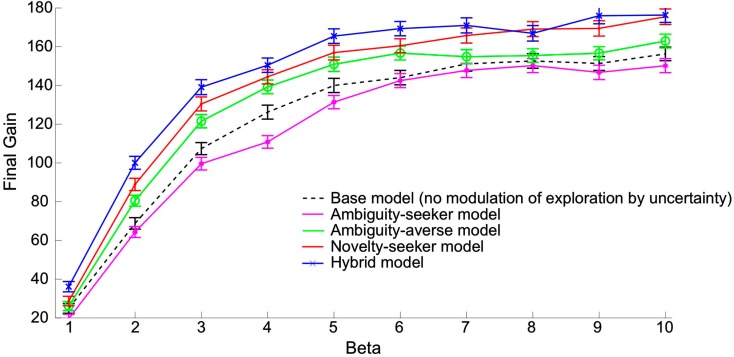
Figure 2.
Economic performances of models featuring different kinds of uncertainty-driven exploration, as a function of the inverse temperature. Each point reports the economic performance averaged across 500 simulations of 500 trials each. Performance is measured by the amount of money accumulated till the 500th trial (“final gain”). X-axis: β parameter (inverse temperature in the softmax rule). Y-axis: average final gain across 500 simulations. Star (*): performance of the ambiguity seeker model. Circle (o): performance of the ambiguity averse model. Dot (.): performance of the novelty seeker model. Cross (×): performance of the hybrid model. The hybrid model combines ambiguity aversion and novelty seeking as described in the main text. Dashed line: performance of the base model in which there is no uncertainty-driven exploration (for reference). Vertical bars represent standard errors.

