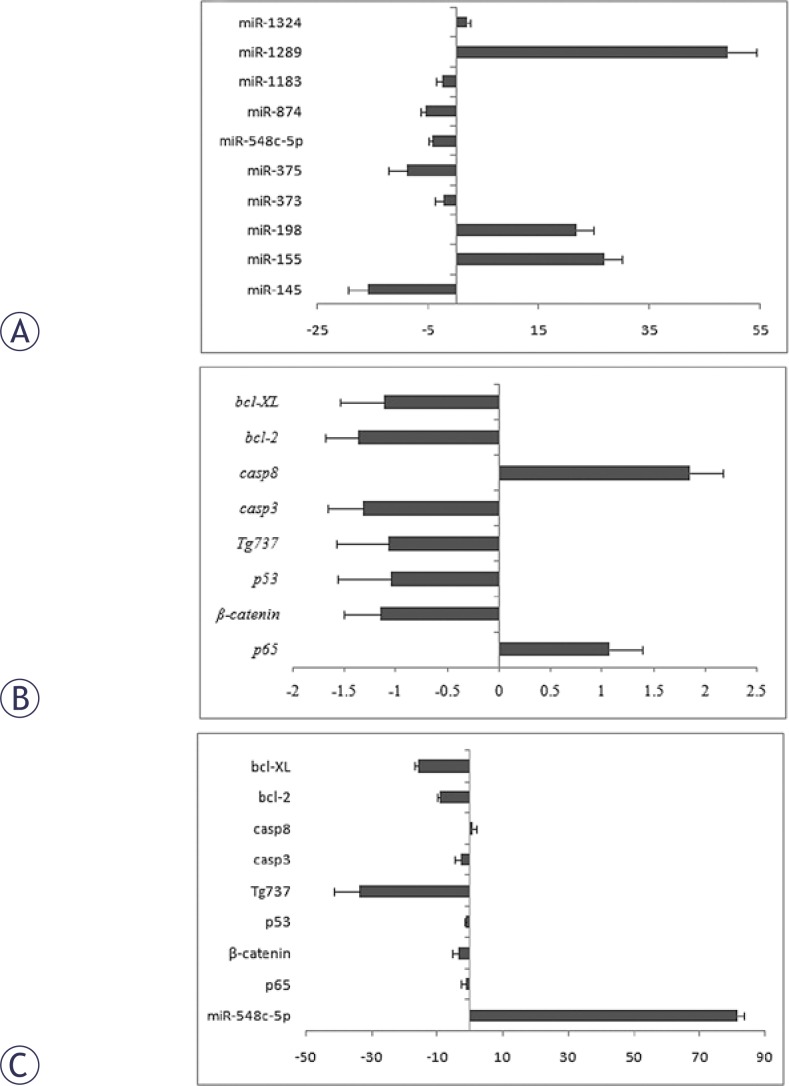
FIGURE 1.
miRNA and gene expressions in CD90+ HepG2 cells as compared to CD90− HepG2 cells. (A) Fold-change in miRNA expressions in CD90+ HepG2 cells. (B) Fold-change in expression of target genes in CD90+ HepG2 cells. (C) Fold-change in expression of target genes 48 h after miR-548c-5p transfection as compared to untransfected CD90+ HepG2 cells. Bars represent the mean value. Positive fold change represents up-regulation and negative fold change represents down-regulation.

