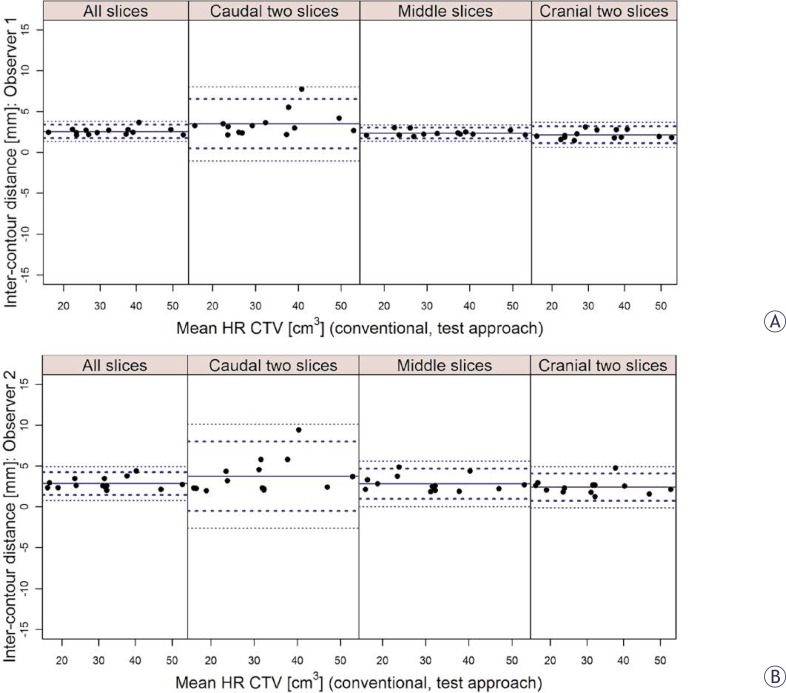
FIGURE 2.
Bland-Altman inter-approach analysis of the distances between contours for observer 1 (A) and 2 (B) and for different levels of the contoured volume (all, caudal two, middle and cranial two slices). Full circles: mean values (mm) of the individual distances. Thick dotted lines: limits of agreement (mean ± 2 standard deviations). Thin dotted lines: 95% confidence limits.

