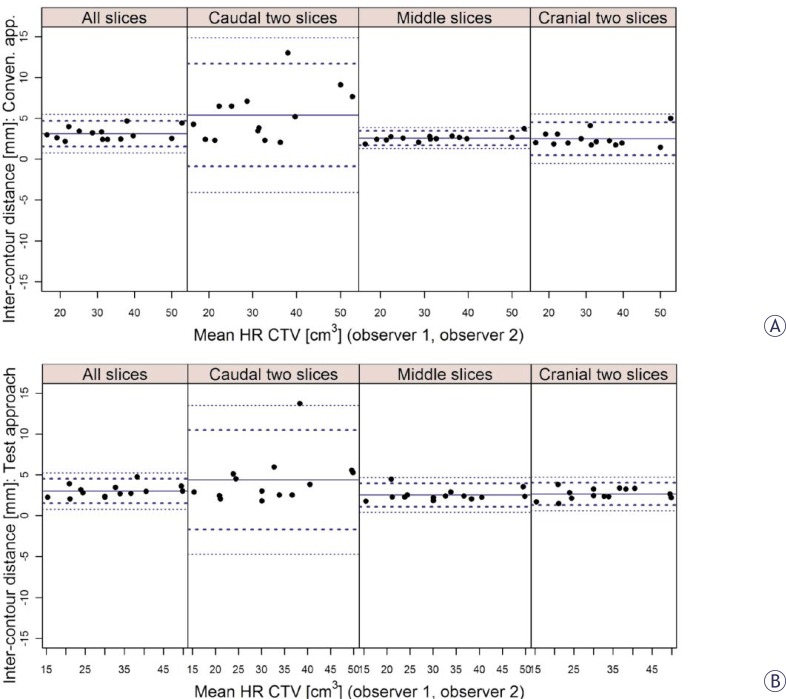
FIGURE 3.
Bland-Altman inter-observer analysis of the distances between contours for conventional (A) and test (B) approach and for different levels of the contoured volume (all, caudal two, middle and cranial two slices). Full circles: mean values (mm) of the individual distances. Thick dotted lines: limits of agreement (mean ± 2 standard deviations). Thin dotted lines: 95% confidence limits.

