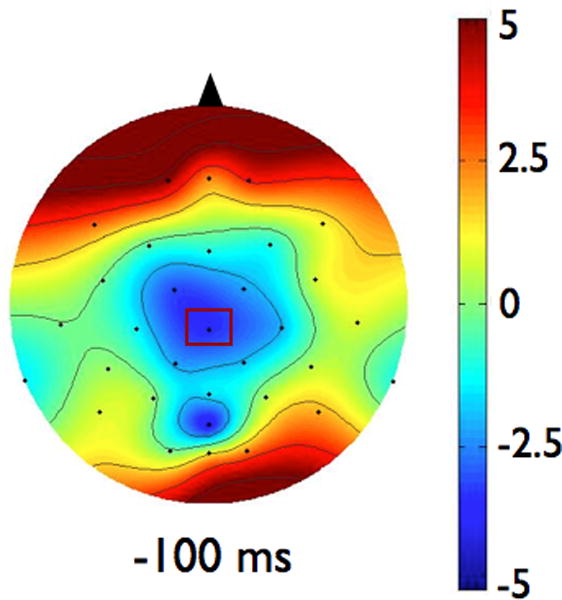
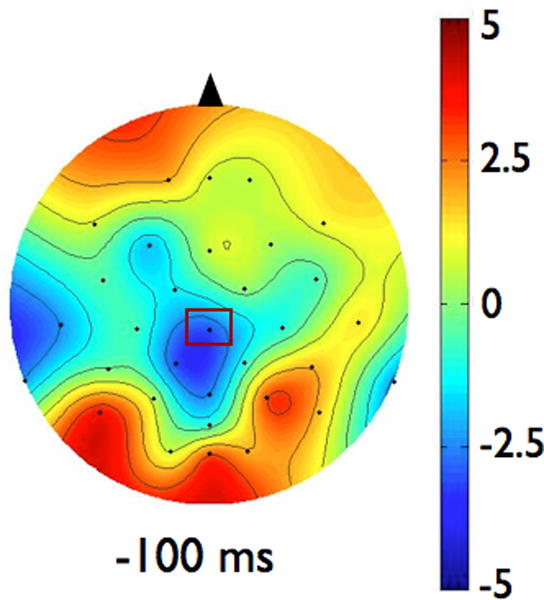
Fig 1.


Scalp topographies represent the average voltage of the signal for each group across all electrodes at 100 ms before the imperative signal (postural perturbation). Scalp topographies were observed to be consistent across the last 500 ms so a representative time point is shown here. The view is of the head, from above, with the nose toward the top of the figure. Figure 1a shows data from the Parkinson’s disease (PD) group. Figure 1b presents data from the control group. To examine the effects of magnitude and predictability on the amplitude of CNV, we chose to analyze data from the electrode in each group that demonstrated the largest amplitude CNV. In both groups, largest CNV was at electrode CZ, which is marked in rectangles on the scalp topographies
