
Fig 3.
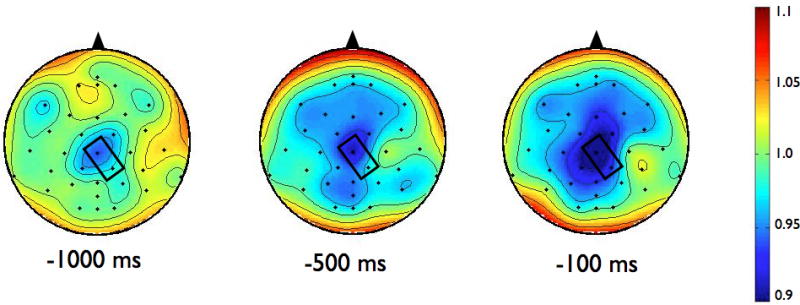
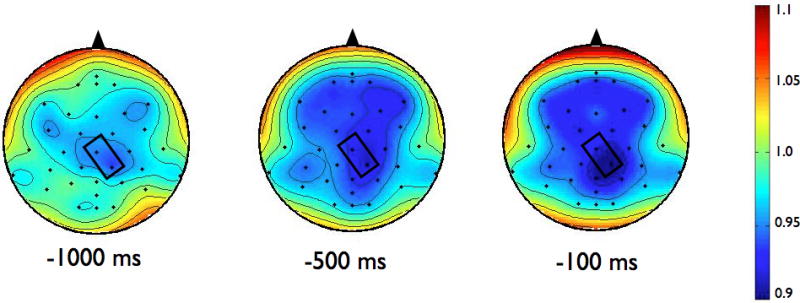
Scalp topographies of the upper beta-band (20–29 Hz) event-related desynchronization (ERD). Figure 3a presents the Parkinson’s disease (PD) group while 3b shows the control group. To examine the effects of magnitude and predictability, we chose to analyze data across the 1000 ms preceding the perturbation from the electrode in each group that demonstrated the most desynchronization. For beta ERD, the largest amount of desynchronization occurred at the CZ electrode in the PD group and at the CP2 electrode in the control group. Both electrodes are marked in rectangles on the scalp topographies