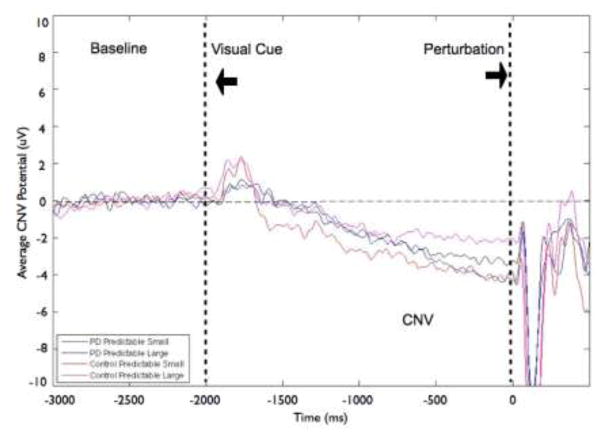
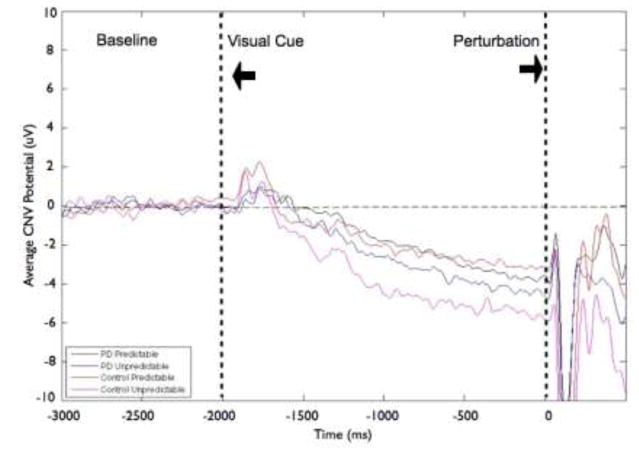
Fig 5.
Grand averages of contingent negative variation (CNV) amplitudes at the CZ electrode by group and condition. Figure 5a shows data from the Parkinson’s disease (PD) and control groups for the effects of magnitude (predictable small vs. predictable large). Figure 5b presents data from the PD and control groups for the effects of predictability (predictable vs. unpredictable-in-magnitude). Data were low-pass filtered at 15 Hz for display purposes only (not during analysis). Baseline is −3000 to −2000 ms, followed by the visual warning cue at −2000 ms and perturbation onset at 0 ms


