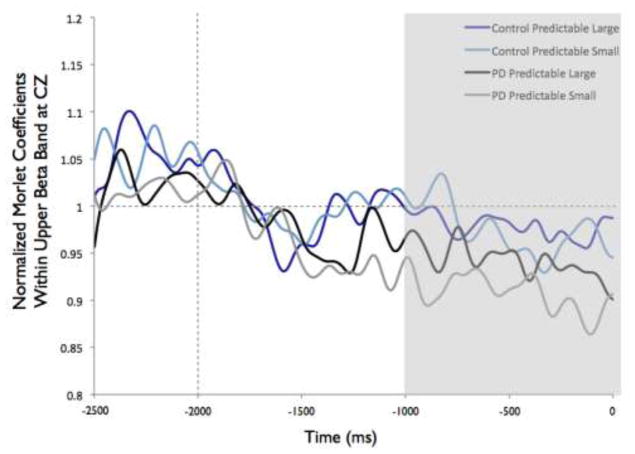
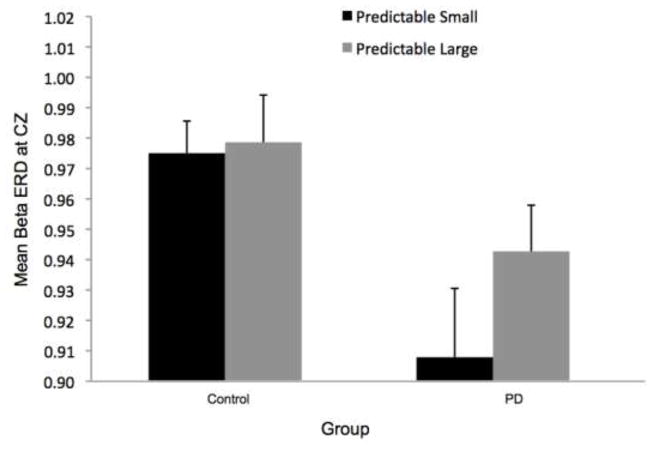
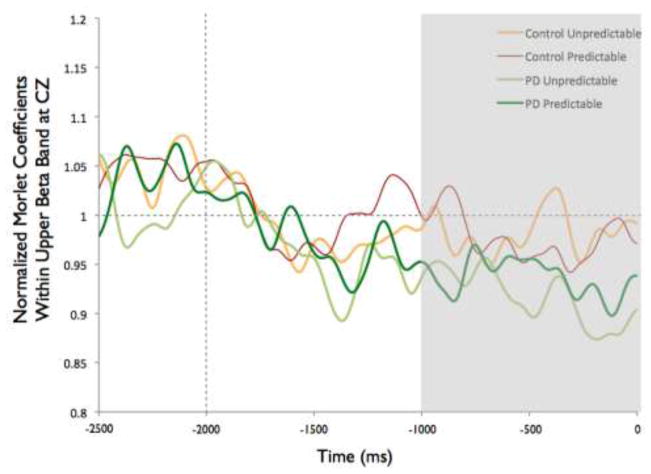
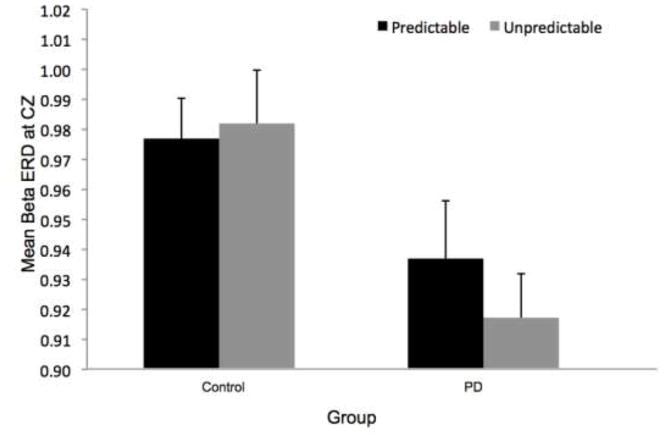
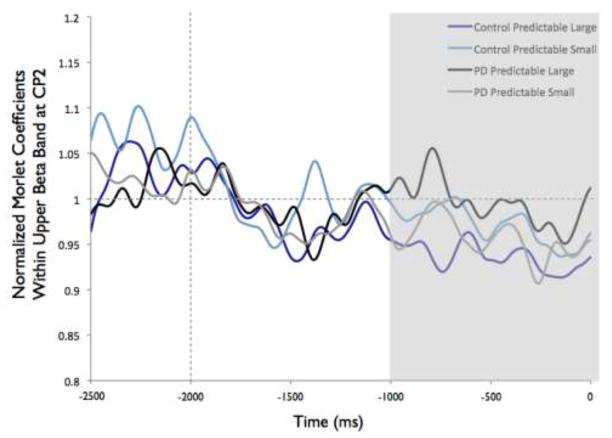
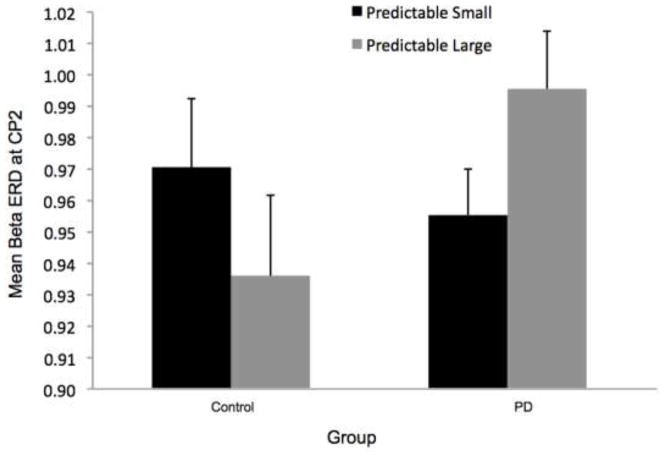
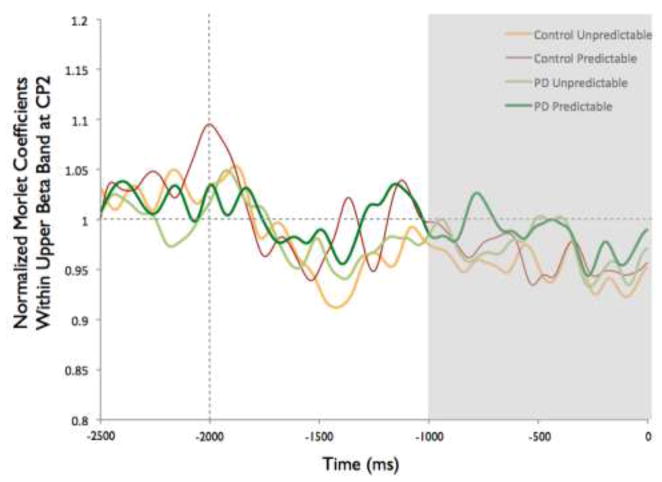
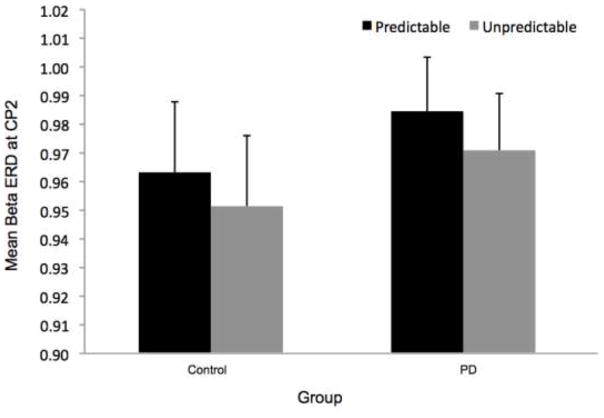
Fig 8.
Group means for beta event-related desynchronization by condition at electrodes CP2 and CZ. Figure 8a presents time-varying morlet coefficients, normalized to baseline activity, of upper beta-band (20–29 Hz) activity at CZ, showing the effects of magnitude (predictable small vs. predictable large). The vertical gray line at −2000 ms represents the onset of the warning cue and 0 s represents perturbation onset. The gray background highlights the final 1000-ms epoch prior to the perturbation used to calculate an average ERD for statistical analysis, which is further summarized in Figure 8b. Smaller values represent greater ERD, referenced to a baseline value of 1. Error bars represent the standard error of the mean. PD = Parkinson’s disease. Figures 8c and 8d similarly present the effects of predictability (predictable vs. unpredictable-in-magnitude). Figures 8e–8h present electrode CP2

