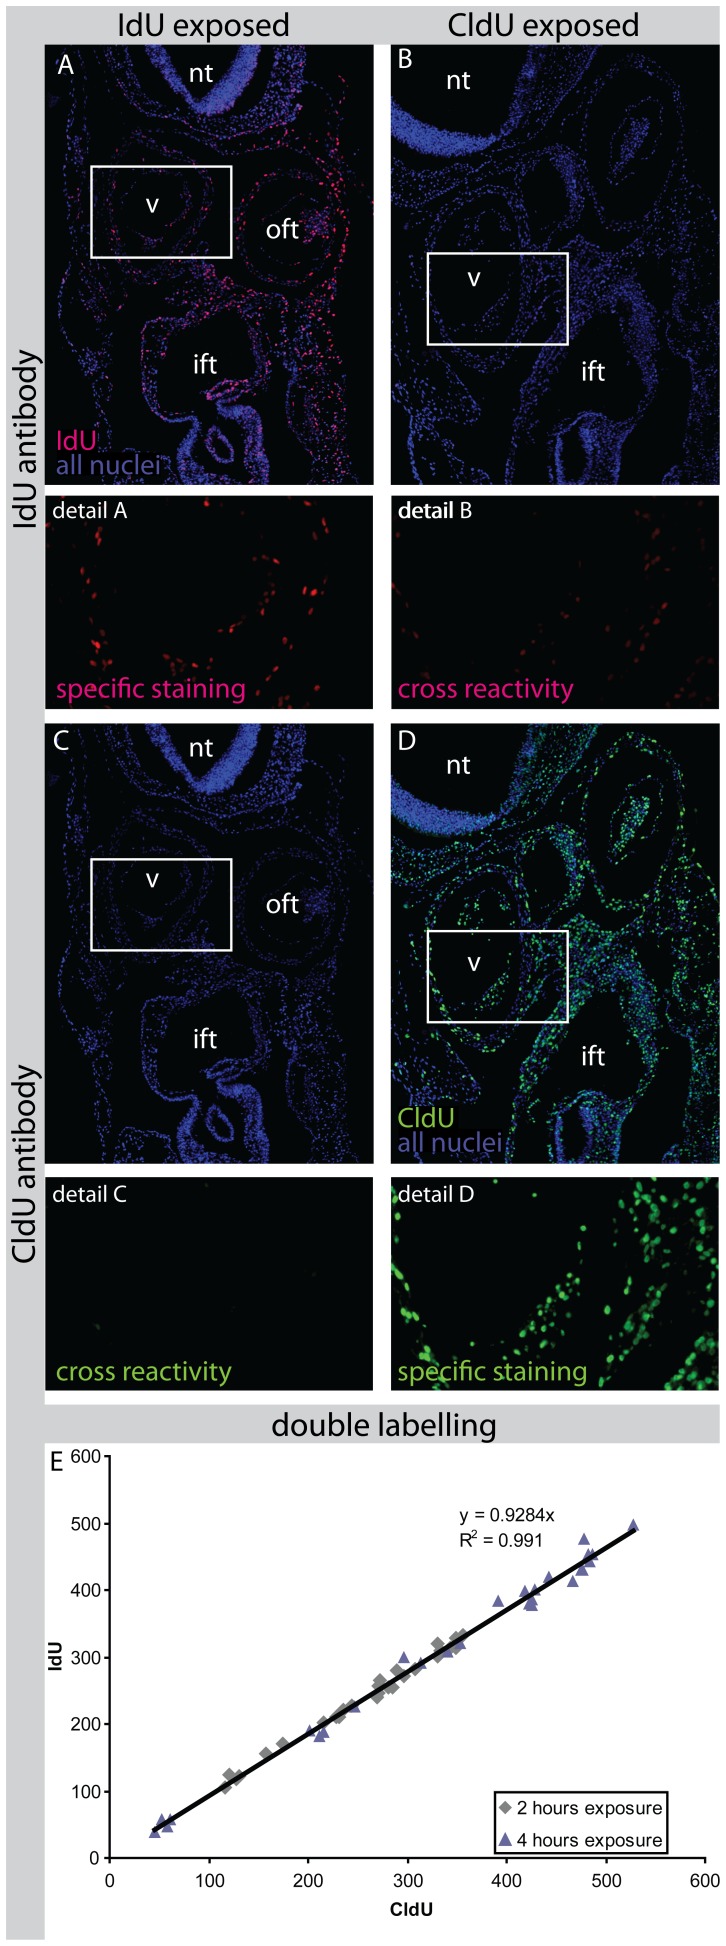
Figure 2. Cross-reactivity and validation of antibody staining.
Section of an embryo exposed to IdU shows specific staining using an antibody against IdU (Panel A). When an antibody against CldU is used there is no aspecific staining visible (Panel C). When an embryo is exposed to CldU and an antibody agains IdU is used some cross reactivity is observed (Panel B). Panel D shows specific staining for CldU. Abbreviations: ift: Inflow Tract; nt: Neural Tubel; oft: Outflow Tract; v: Ventricle. Panel E shows the relation between the number of nuclei labelled for IdU and for CldU at equal exposure times. Each point represents a section. There was no significant difference between 2 and 4 hours of exposure time. The linear relation shows a high correlation coefficient (R2 = 0.991) and detection of 7.2% less IdU than CldU positive nuclei.

