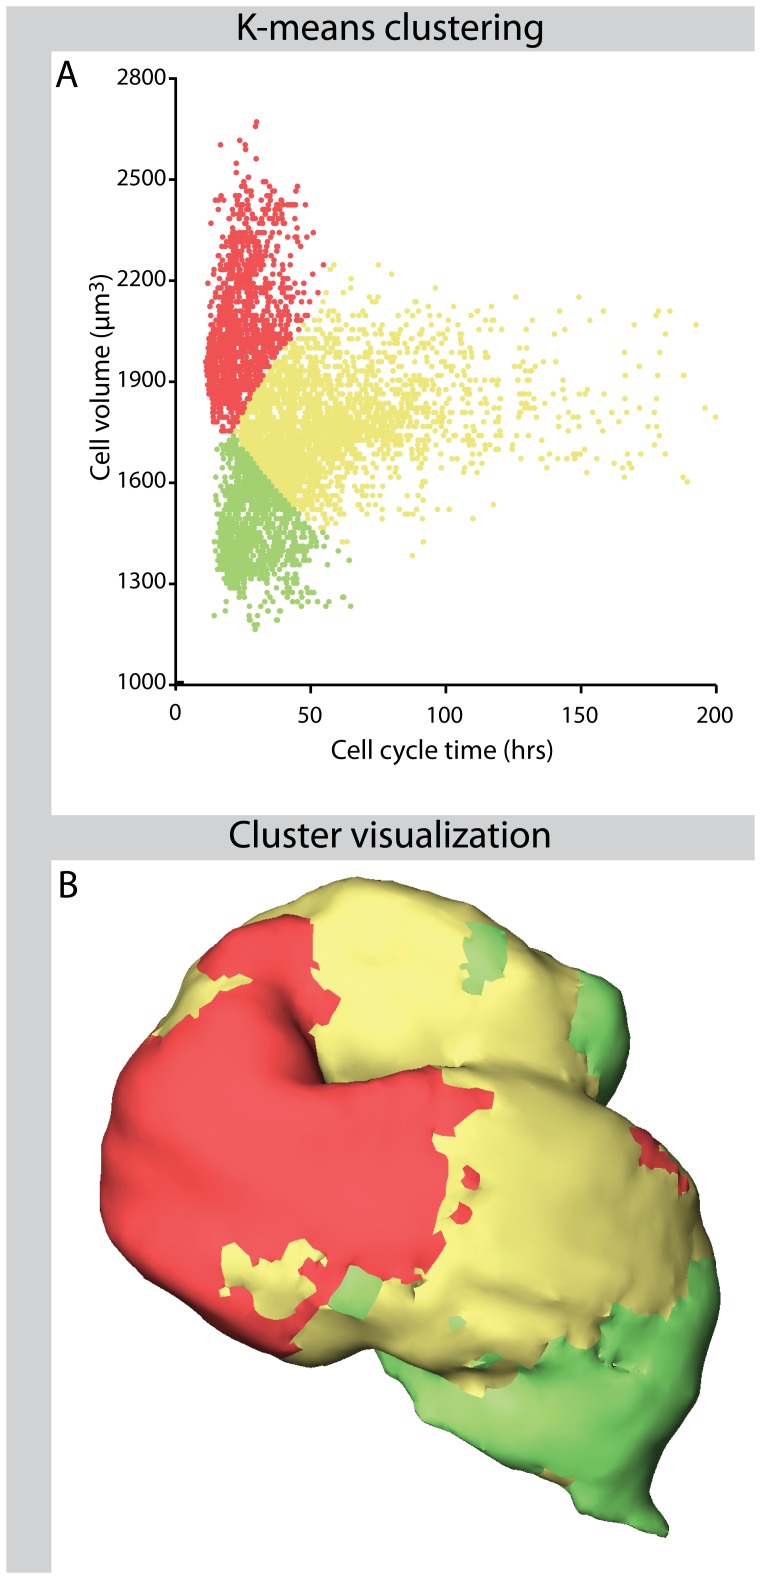
Figure 5. Cell size - cell cycle length clustering and visualisation.
Panel A shows a k-means cluster analysis of boxels based on their cell volume and their cell cycle length. Panel B shows the result of plotting cluster membership of each boxel into the HH12 myocardium reconstruction. Although spatial information was not used in the cluster procedure, the resulting clusters show clear spatial continuity.

