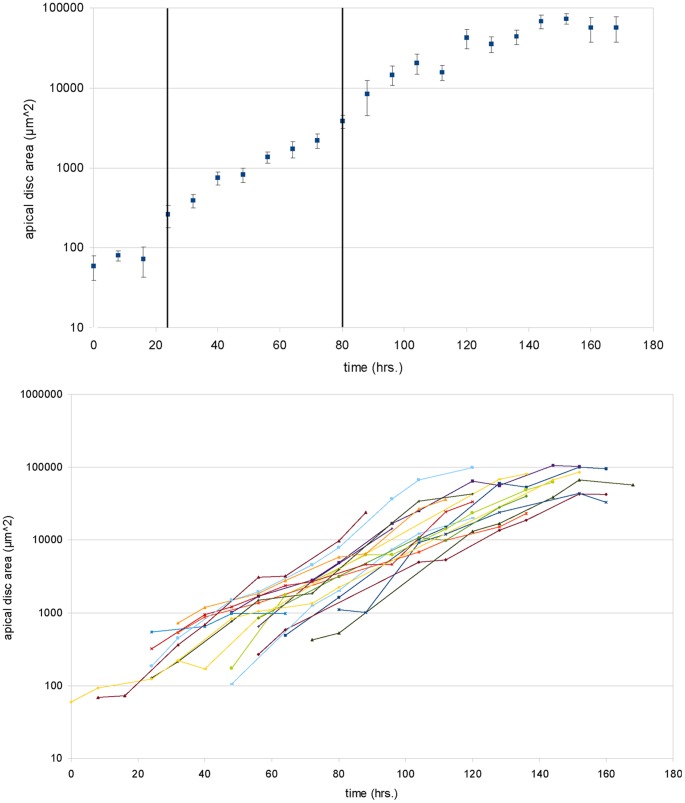
Figure 2. Growth curves of wing disc area during the larval stages.
A: Semi-logarithmic plot of the average apical disc area as a function of time. The times were normalized, such that the first point in the third instar coincided with 80 hrs. The first instar with moderate growth ends after about 24 hrs. In the second (24–72 hrs.) and early third instars, growth is nearly exponential. In the late third instar the slope of the line decreases, indicating a decrease in the average growth rate. The error bars indicate the standard error of the respective time point. Note that in these experiments the larvae are kept at 22(1) °C, which explains the longer time periods of the different growth phases. The vertical lines delineate different instar stages of the larvae. B: Semi-logarithmic plot of the apical disc area for different larvae over time. The average of these growth curves yields the graph shown in part A. Each larva develops individually, yet there is generally moderate growth in the first instar, exponential growth in the second and early third and a decrease in the growth rate in the late third instar. The differences in the growth rates of individual larvae indicate that external factors play a role in wing disc development.

