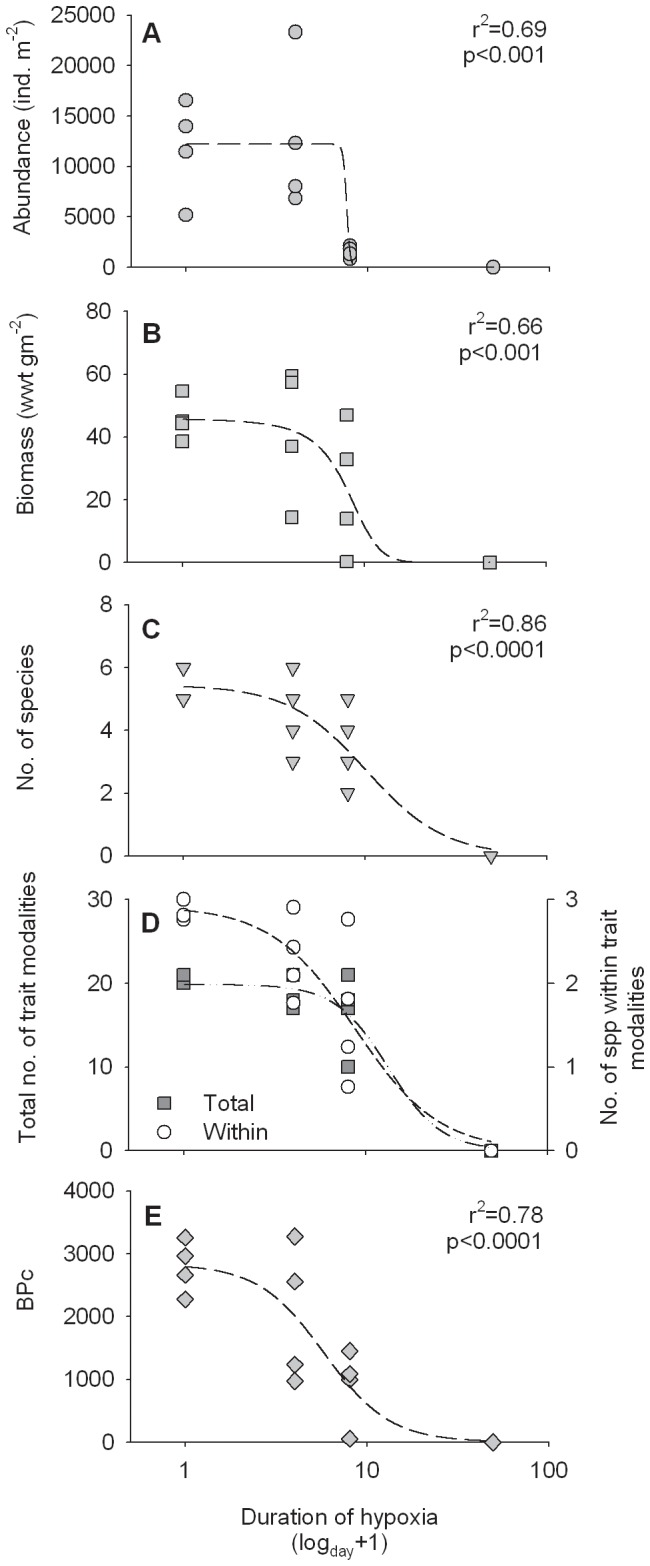
Figure 2. The effect of increasing duration of hypoxia on benthic parameters.

(A) abundance (B) biomass (C) number of species (D) total number of trait modalities present (filled squares, primary y-axis, r2 = 0.93, p<0.001) and the average number of species within trait modalities (white circles, secondary y-axis, r2 = 0.86, p<0.001) and (E) the community bioturbation potential (BPc). Mya arenaria is excluded from the biomass data. Non-linear regression curves were fitted to the plotted data (Table S2). For presentation, the x-axes are log (x + 1) transformed.
