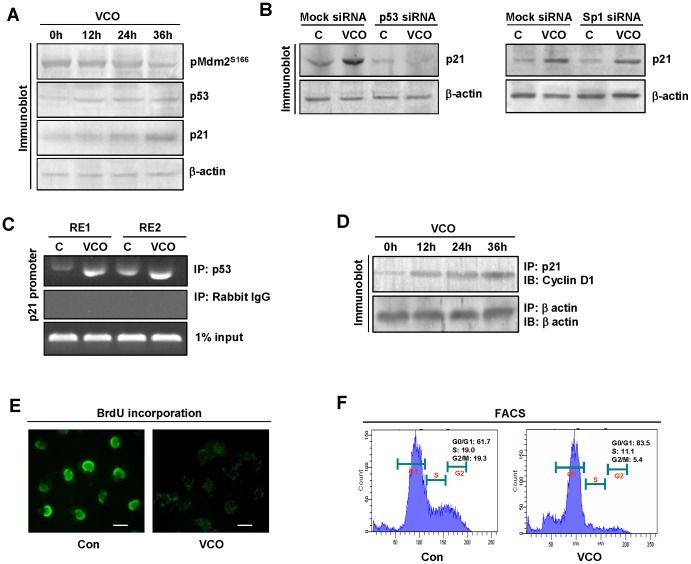
Figure 6. VCO halted cell cycle progression at G1- S phase by impairing Cyclin D1.
(A) Immunoblot analysis of pMdm2 Ser166, p21 and p53 was analyzed in control or VCO exposed A549 cells at indicated time periods. β-actin used as internal loading control. (B) Immunoblot showed p21 level in p53 siRNA or Sp1 siRNA or their control siRNA transfected A549 cells exposed with or without VCO. (C) ChIP assay demonstrated VCO exposure increases binding of p53 to its response element (RE1 and RE2) on p21 promoter. (D) Cyclin D1-p21 interaction was increased with increasing the time of VCO exposure, which was shown by co-immunoprecipitation study. (E) BrdU incorporation in control and VCO treated A549 cells were examined by florescence microscopy. (F) FACS analysis showed cell cycle arrest at G1 to S phase as indicated by increased percentage of G0/G1 cells with the decrease of S and G2/M phase cells. Bar represents 20 µm.

