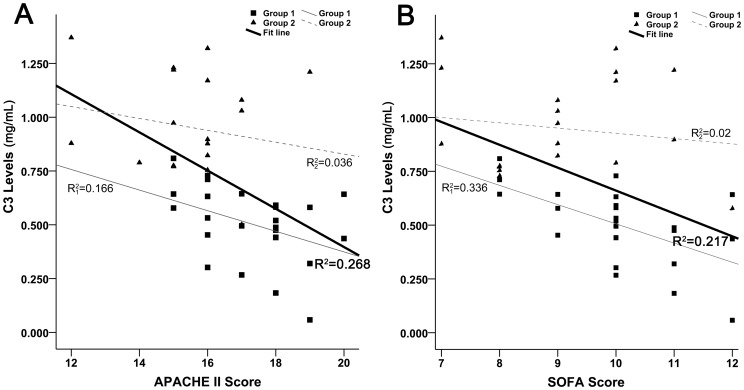
Figure 2. The correlation analysis between baseline levels of C3 and severity scores.
(A) The relationship between C3 and APACHE II score. Data in both groups were pooled for analysis (n = 45). The linear regression indicates that the baseline levels of C3 have little correlation with APACHE II score (R2 = 0.268). (B) The relationship between C3 and SOFA score. Data in all patients were included for analysis (n = 45). The regression result shows that C3 have no correlation with SOFA score (R2 = 0.217). In addition, linear regression for each group was performed, with similar results to the pool.

