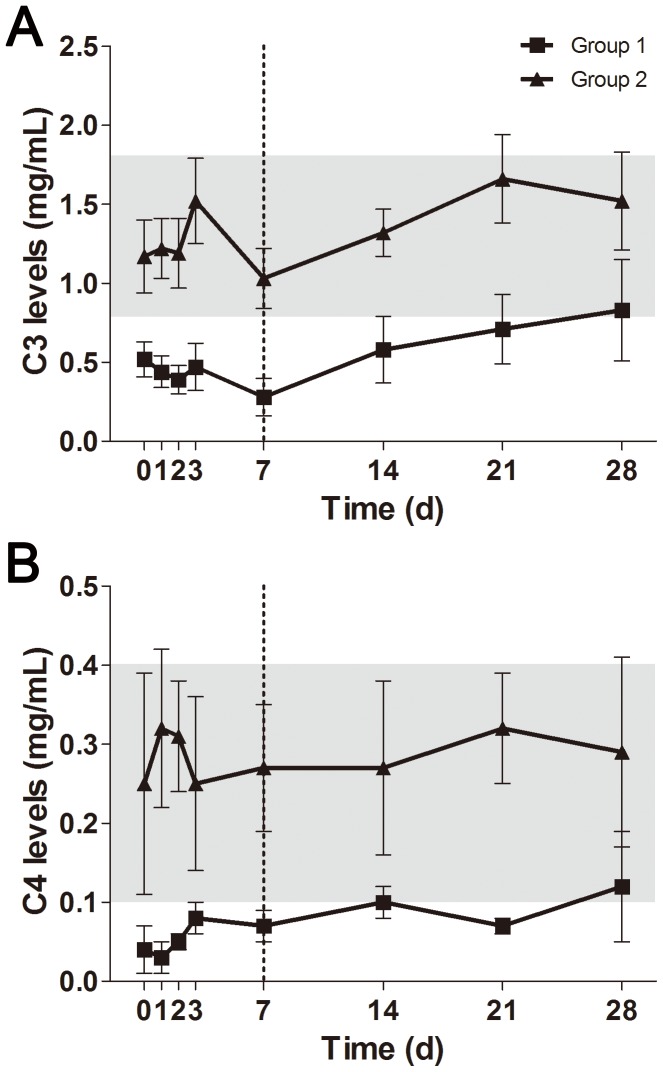
Figure 3. The observed changes of complement components in management of sepsis.
These dynamic changes were directly compared between group 1 and group 2. Plasma levels of C3 (A) and C4 (B) within 28-day observation were quite different between both groups (P<0.001). The gray area indicates the normal reference range. Data present as mean ± SD.

