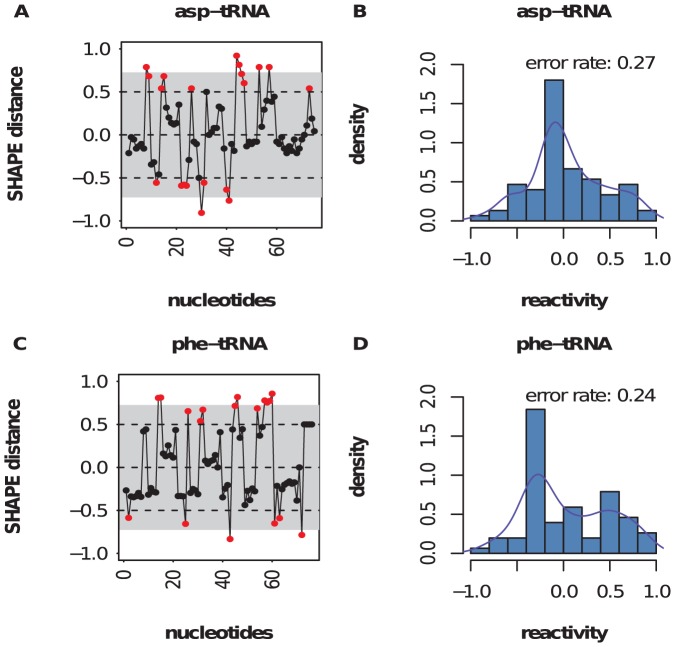
Figure 3. Shape discrepancies.
Distribution of shape discrepancies in yeast asp-tRNA (top) and E. coli phe-tRNA (bottom). shape data for asp-tRNA [resp. phe-tRNA] from the Weeks Lab [25] [resp. Das Lab [26]]. Using crystal structure as ‘gold standard’, red squares indicate locations where the absolute value of the difference of shape data and crystal structure (1 unpaired, 0 paired) exceeds 0.5. The plots on the right show the distribution of the discrepancy in shape as well as the error rate.

