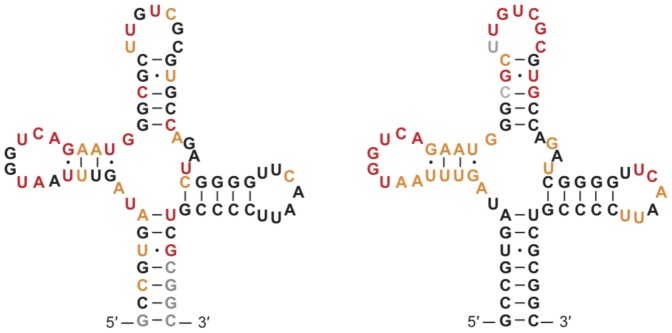
Figure 6. Heat maps of in-line probing and shape.
Heat maps illustrating differences between in-line probing (left) and shape (right) analysis of the yeast asp-tRNA. Nucleotides are colored corresponding to cumulative activities described in Figure 3, where the least reactive  of bases are black (
 of bases are paired in the crystal structure), the most reactive
  of bases are red, and the next most reactive
  are yellow. Gray bases are bases for which there is no data available.

