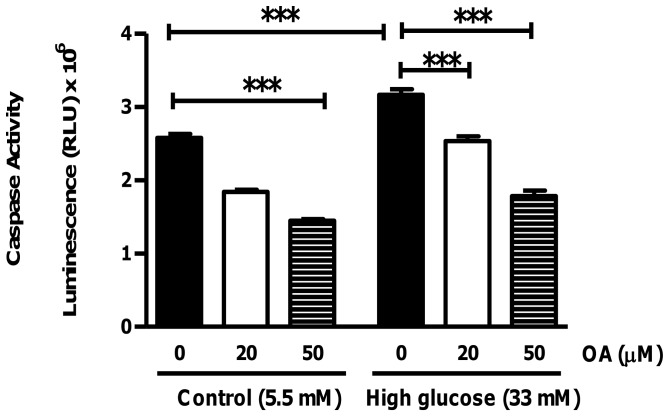
Figure 2. Decreased apoptotic cell death in H9c2 cells treated with OA (caspase activity).
Evaluation of caspase activity in H9c2 cells in response to simulated chronic hyperglycemia vs. control ± treatment with 20 µM and 50 µM OA, respectively, for 24 hr. Values are expressed as mean ± SEM (n = 9). ***p<0.001 vs. respective controls.

