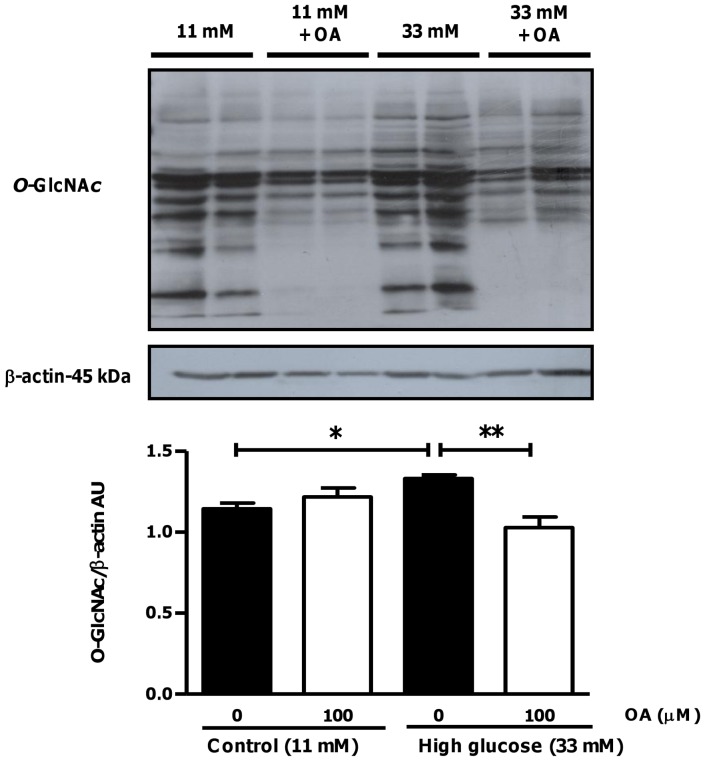
Figure 13. OA treatment attenuates O-GlcNAcylation in hearts subjected to ischemia-reperfusion under high glucose conditions.
Isolated rat hearts were perfused under high glucose conditions vs. controls and subjected to ischemia-reperfusion ± OA treatment during reperfusion. Western blot analysis for overall O-GlcNAcylation is shown with β–actin as loading control. Densitometric analysis for O-GlcNAcylation is displayed below gel image (normalized to corresponding β–actin values). Values are expressed as mean ± SEM (n = 6). *p<0.05, **p<0.01 vs. respective controls.

