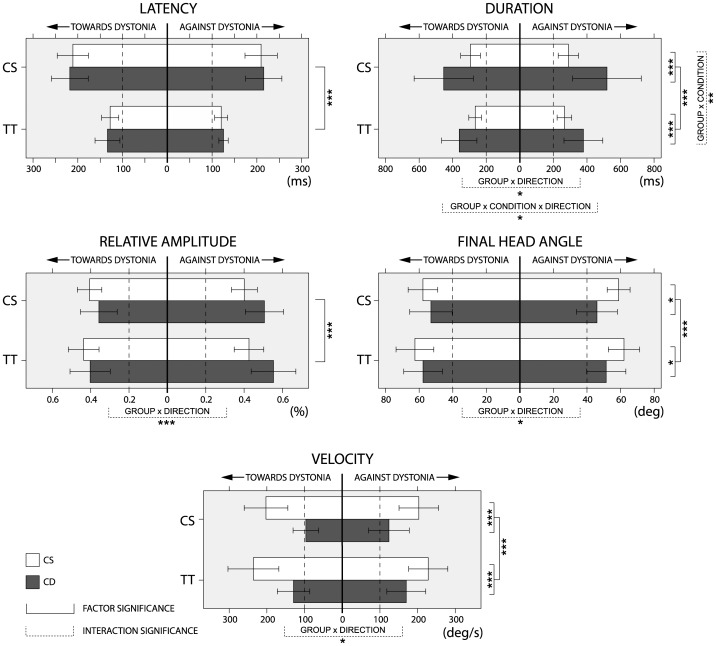
Figure 4. Schematic representation of data obtained in measuring the kinematic parameters of rotational head movements.
Data on kinematic parameters of rotational head movements (RM) were extracted from high-speed video-recordings, in control subjects (CS) and patients with cervical dystonia (CD) in control and test trials. Data in CS are shown for right and left side RMs while data in CD are shown for RM ‘towards’ and ‘against’ the dystonic thrust. Significant differences are shown for factor (full lines) and interaction (dashed lines) according to the number of asterisks (* = P<0.05, ** = P<0.01, *** = P<0.001). The whiskers represent standard deviations. Note the similarity of the effects occurring in test trials in all kinematic parameters in both groups of subjects.

