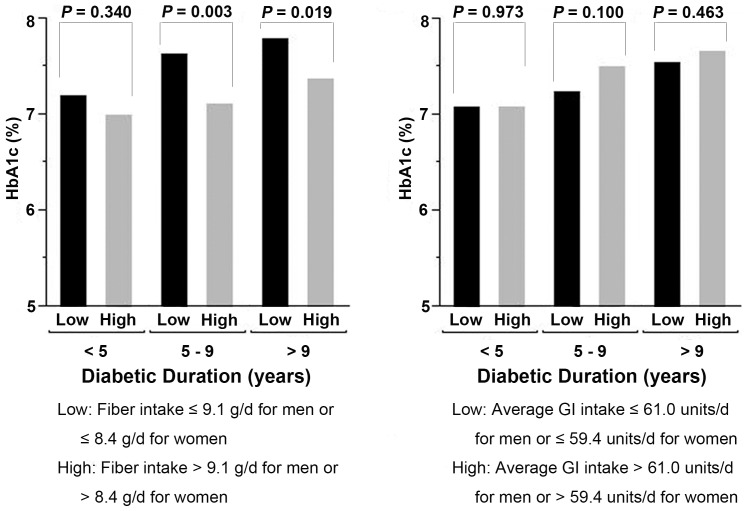
Figure 1. Average levels of HbA1c by duration of type 2 diabetes and dietary fiber or GI intake.
The low and high fiber or GI intakes were classified by the medians of consumption in men and women, respectively. Means of HbA1c level were adjusted for age (as a continuous variable), sex (male/female), duration of type 2 diabetes (as a continuous variable), BMI (as a continuous variable), oral hypoglycemic drug use (yes/no), insulin use (yes/no) and energy intake (as a continuous variable).

