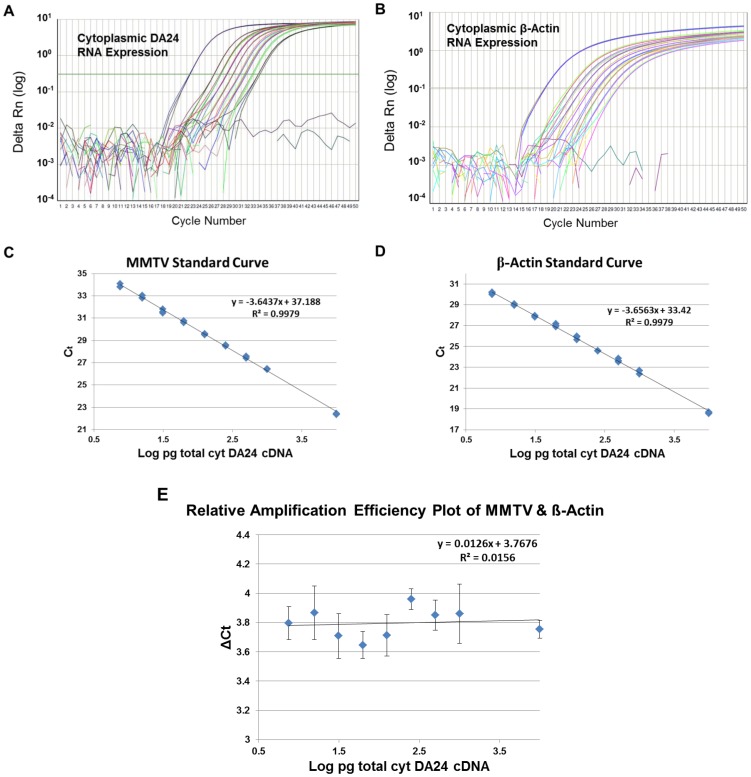
Figure 3. Validation of the real time PCR assay developed for relative quantification of transfer vector RNA expression using the Ct slope method.
Determination of the threshold cycles (Ct) of the cDNA prepared from 293T cytoplasmic RNA expressing transfer vector DA24 tested in triplicates as 10- and 2-fold dilutions by the (A) custom-made MMTV Taqman assay, and (B) the ß-actin Taqman assay. ΔRn is the target gene-specific fluorescence signal (FAM for MMTV-specific and VIC for ß-actin-specific sequences) normalized to the signal for the internal passive control, ROX (Normalized Reporter or Rn) from which the baseline target fluorescence has been subtracted (ΔRn = Normalized Reporter (Rn) - baseline). Standard curves of the (C) MMTV and (D) ß-actin Taqman assays were generated to determine their ΔCt values (Ct values of the MMTV assay – Ct value of the ß-actin endogenous control) that were needed to allow comparison of amplification efficiencies of the two assays. (E) Relative amplification efficiencies of the two assays as determined by the analysis of ΔCt value variations with the amount of input template cDNAs. For the two assays to have similar amplification efficiencies, the value of the slope of log input amount verses ΔCT should be approximately zero (<0.1), which under our experimental conditions were calculated to be 0.0126, thus validating the assay for the relative quantification analysis.

