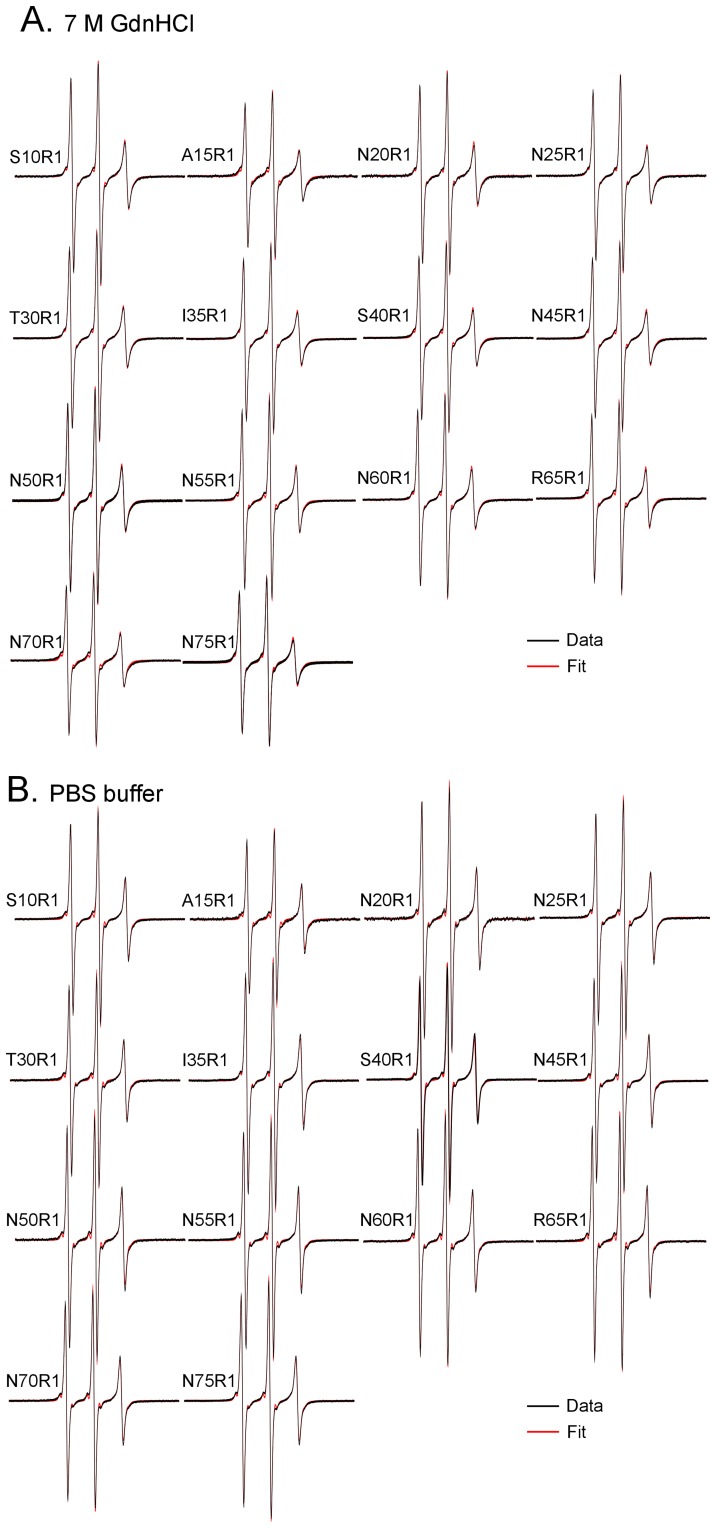
Figure 2. EPR spectra of spin-labeled Ure2p1–89-M tethered on solid support.
(A) EPR spectra in 7 M GdnHCl. (B) EPR spectra in PBS. Experimental spectra are shown in black and best non-linear least squares fits are shown in red. All spectra were simulated well with one spectral component, suggesting a single structural state at all labeled sites.

