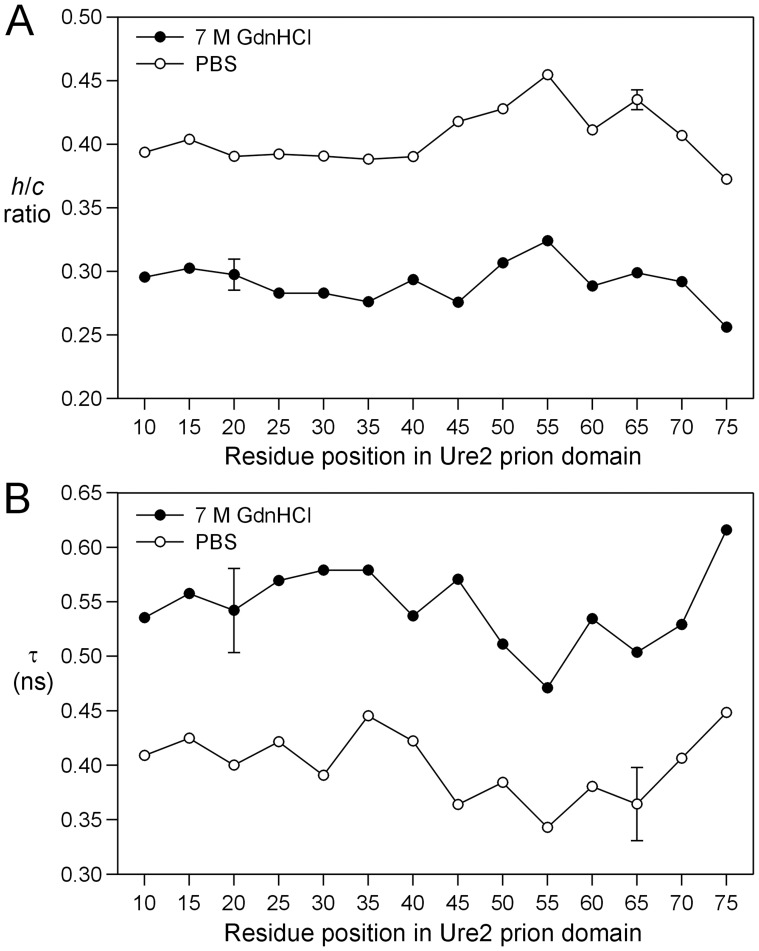
Figure 4. Site-specific spin label mobility in Ure2p prion domain.
(A) Plot of the h/c ratio as a function of residue positions in Ure2p1–89-M. Note that the h/c ratio is higher in PBS, suggesting higher mobility in PBS. Additionally, the pattern of residue-specific h/c ratio is similar between the two conditions, suggesting similar structures. (B) Plot of correlation time from spectral simulations as a function of residue positions in Ure2p1–89-M. The error bars for N20R1 (in 7 M GdnHCl) and N65R1 (in PBS) are the standard deviations of two independent experiments. Other data points are results of single experiments.

