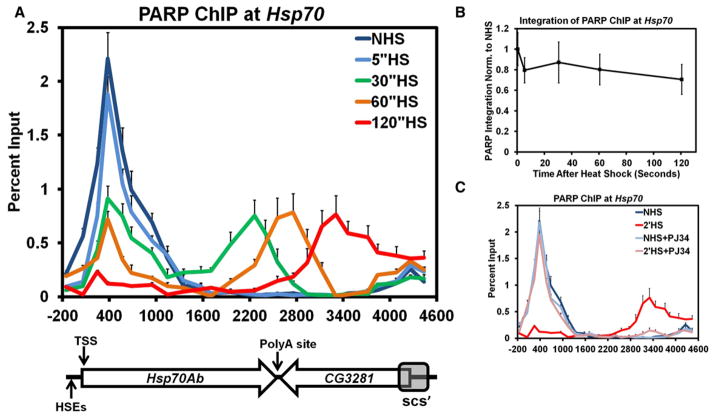
Figure 1. PARP Rapidly Redistributes across theHsp70 Heat Shock Locus upon Heat Shock.
(A) Kinetic ChIP analysis of PARP at the Hsp70Ab HS locus. S2 cells are heat shocked for 0 (dark blue), 5 (light blue), 30 (green), 60 (orange), or 120 s (red). Twenty-five primer sets, spaced approximately 200 bp apart, provide high spatial resolution. The y axis represents the percent of input material immunoprecipitated. The x axis corresponds to base pair units with 0 being the TSS. Error bars represent the SEM of three independent experiments. The diagram below depicts the Hsp70Ab locus, noting the sites of the HSEs, its TSS, the Poly A site (+2343), the downstream gene CG3281, and the site of the scs’ insulator element. The diagram is on the same scale as the x axis. Each subsequent figure labeled as ChIP will be for the Hsp70Ab HS locus and contains the same error bars, y axis, and x axis that correspond to the diagram depicted.
(B) The amount of PARP detected by ChIP at the Hsp70Ab HS locus stays constant during the first 2 min of HS. The ChIP values for each of the 5 HS time points were integrated across the region depicted in (A) using the 25 percent input values as points to trapezoids. Each sum was normalized back to the NHS summation and plotted on the y axis. The x axis represents the elapsed time following HS in seconds. Error bars represent the propagated error associated with the summation of the SEM of each percent input.
(C) ChIP of PARP in the presence of PJ34, a catalytic inhibitor of PARP. Untreated NHS (dark blue) and 2′ HS (red) S2 cells are compared to those NHS (light blue) and 2′ HS (pink) cells pretreated with 300 nM PJ34 for 10 min. Error bars represent the SEM of three independent experiments.

