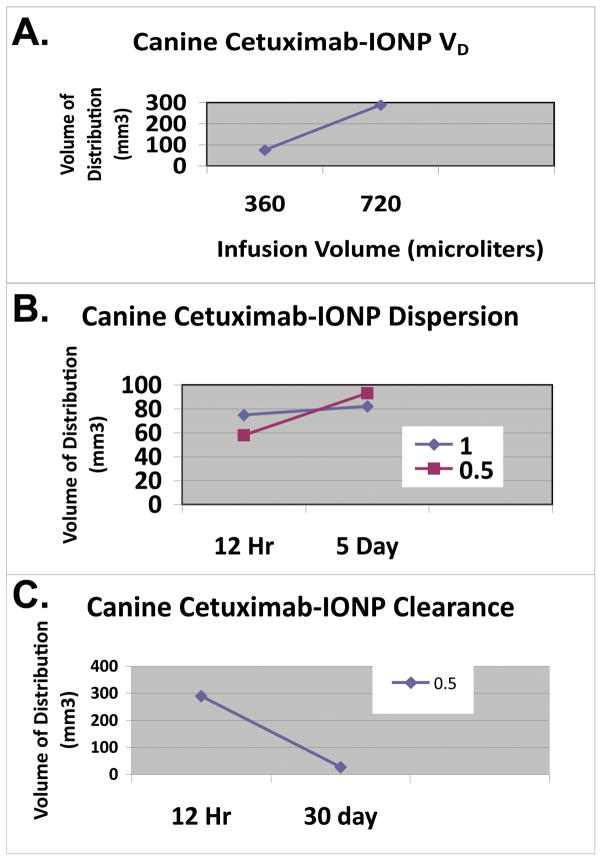
Figure 5. Cetuximab-IONP CED volume of distribution, dispersion, and clearance in the canine brain (Group 2).
A., IONP volume of distribution (VD) after CED was determined by T2 contrast (signal drop) present on T2WI. VD was linearly proportional to the infusion volume (VI). B., Initial IONP VD after CED was determined at 12h on day 0 with a CED infusion rate (IR) of 0.5 or 1.0 μl/min. The VD was determined 5 d after CED confirming dispersion of the bioconjugated IONPs at both IR. Greater IONP dispersion was found at the 0.5 μl/min rate. C., Clearance of IONPs was determined by T2WI VD comparison at 12 h and 30 d after CED of IONPs (0.5 μl/min for 24 h). T2 contrast is almost completely gone at 30 d.

