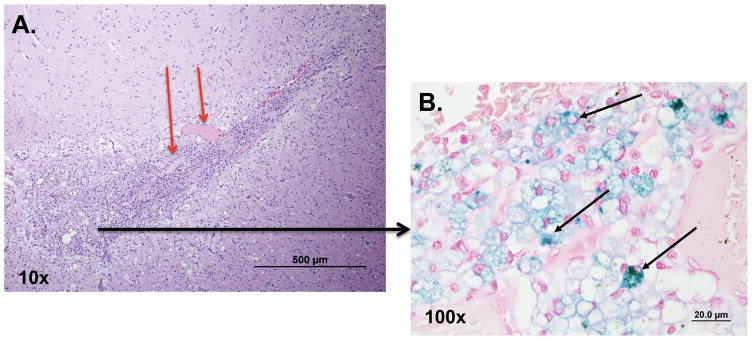
Figure 6. Histopathologic analysis of the catheter tract in the canine brain 30 d after IONP CED.
A., Hematoxylin and eosin stained brain section of the CED catheter site surrounded by gitter cells (phagocytizing microglia) (10 x). Neovascularization is seen as well (shown by red arrows). B., Magnified view (100 x) revealing the presence of iron-filled gitter cells (black arrows) after Perl’s blue staining of brain section.

