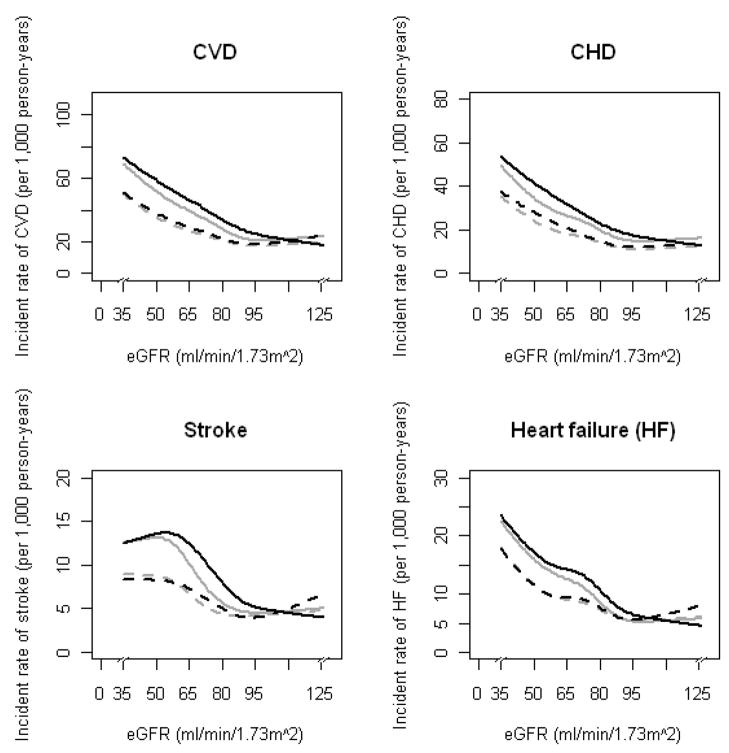
Figure 1.
Incidence rates (per 1,000 person-years) for cardiovascular disease, coronary heart disease, stroke, and heart failure, according to eGFRCKD-EPI (solid and dashed black lines) and eGFRMDRD (solid and dashed gray lines) equations. Solid lines indicate no adjustment and dashed lines indicate adjustment for baseline age and sex. Results were obtained by a Poisson regression model with restricted cubic splines function of eGFR (knots at 45, 60, 75, 90, and 105 mL/min/1.73m2).

