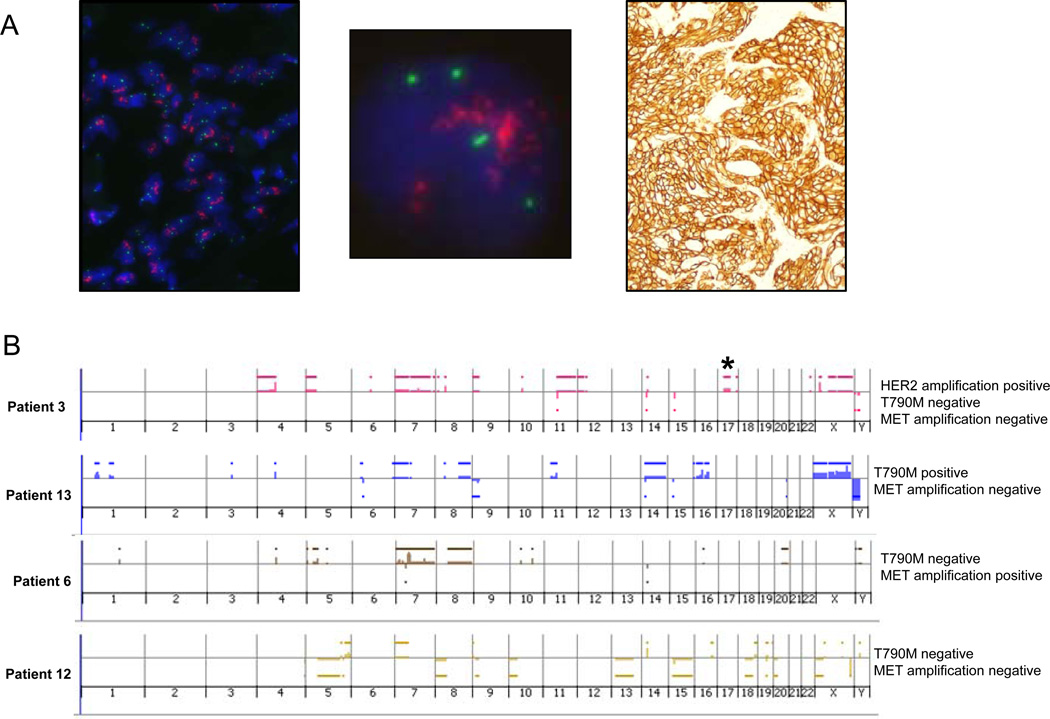
Figure 4. HER2 amplification in EGFR T790M-negative tumors with acquired resistance.
(A) HER2 FISH (left (low magnification), middle (high magnification) panels) from a tumor specimen with acquired resistance to erlotinib. HER2 (red) and CEP17 (green). The PathVysion HER2 probe kit (Abbott) was used for HER2 FISH analysis. The tumor nuclei show multiple, clustered HER2 signals (red) and 2–4 chromosome 17 centromere signals (green), indicating high level HER2 amplification in this case (ratio of Her-2/chromosome17 signals > 2.2). Immunohistochemistry (right panel) was performed on the same case using the HercepTest kit (DAKO), showing strong positive staining for HER2 (3+), according to standard scoring criteria used in breast cancer. (B) Array comparative genomic hybridization data from 12 patients with acquired resistance to gefitinib or erlotinib analyzed using a 60-mer oligonucleotide array platform (Agilent).18 Asterisk denotes amplification in HER2, occurring in 1 of 12 samples. This sample was negative for both T790M mutation and MET amplification. Lower panels show representative examples without HER2 amplification.

