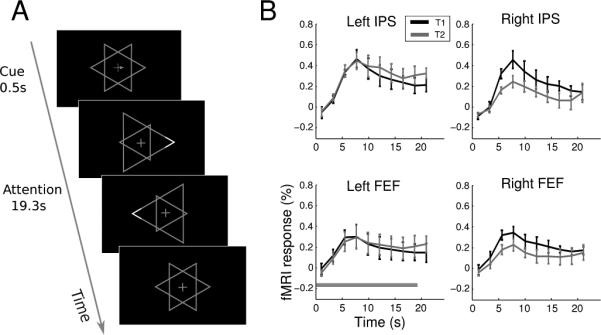
Figure 6.

Control experiment: task and results. (A). Schematic of a trial in the control experiment. (B). Mean time course (N=4) of two regions (IPS and FEF) in each hemisphere. The horizontal bar in the lower left panel indicates the duration of a trial. Error bars denote ±1 s.e.m. across participants.
