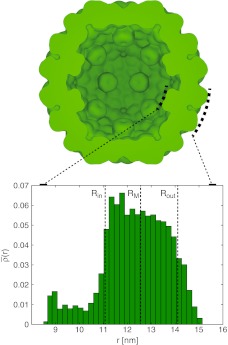
Fig. 2.
Cross-section of (experimentally determined) capsid mass distribution in the example of the cucumber mosaic virus (ssRNA) capsid (strain FNY), constructed from RCSB Protein Databank entry 1f15. The drawing was constructed with a procedure described in Ref. [3] with W = 1.34 nm and t = 0.85, where all amino acids were assigned strength (“q/e0”) 1. Protrusions can be seen on the capsid interior which are the roots of protein N-tails; comparison with the full protein sequence shows that they are not complete. The inset shows the radial mass distribution (1) across the capsid, normalized so that total area of the histogram equals 1; the mean capsid radius RM (single-shell model) and the inner and outer radii Rin and Rout (double-shell model) are indicated

