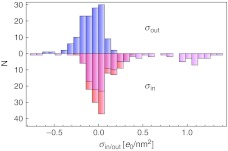
Fig. 9.
A histogram showing the distribution of inner and outer surface charge densities of the double-shell model in the sample of viruses used in the analysis. The upper part shows the outer surface charge density (blue), and the lower part shows the inner surface charge density without (red) and with added charge of the N-tails (magenta)

