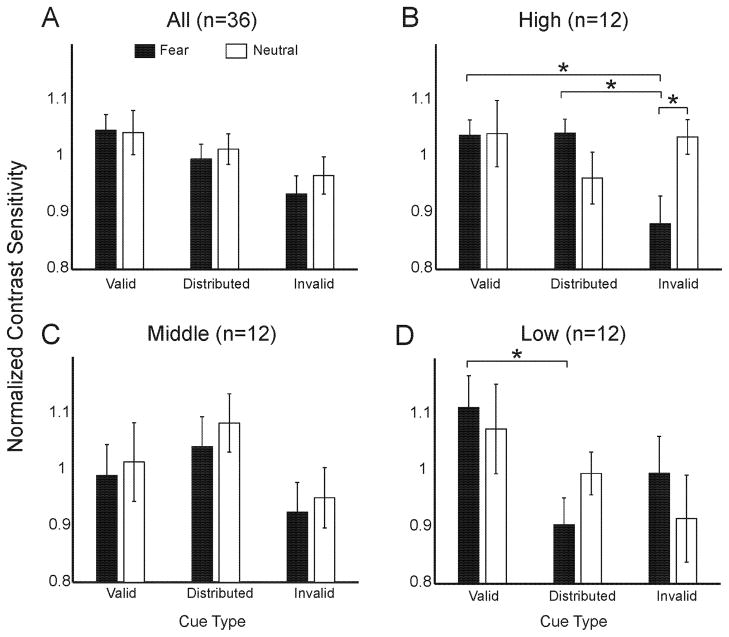
Figure 2.
A–D: Cueing effects: all observers and by anxiety. The Y-axis is normalized contrast sensitivity. The X-axis is spatial cueing condition. Black bars indicate fear face cues and white bars indicate neutral face cues. (*) indicates a significant two-tailed t-test. Error bars are ± 1 SE of mean. A) All observers; B) high trait anxious observers; C) middle trait anxious observers; and D) low trait anxious observers.

