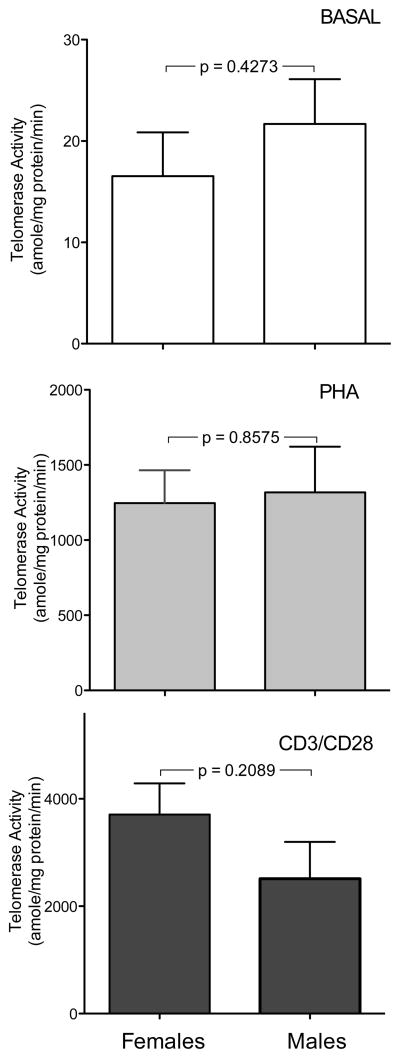
Figure 3.
Quantitation of telomerase activity in cultured PBMCs from females (left columns; n = 7) and males (right columns; n = 9). Cells were cultured as described under basal conditions (top panels) or stimulated with PHA (middle panels) or anti CD3/CD28 (bottom panels). Telomerase activity is shown as amole of product/min/mg protein. Note differences in scales between various treatments.

