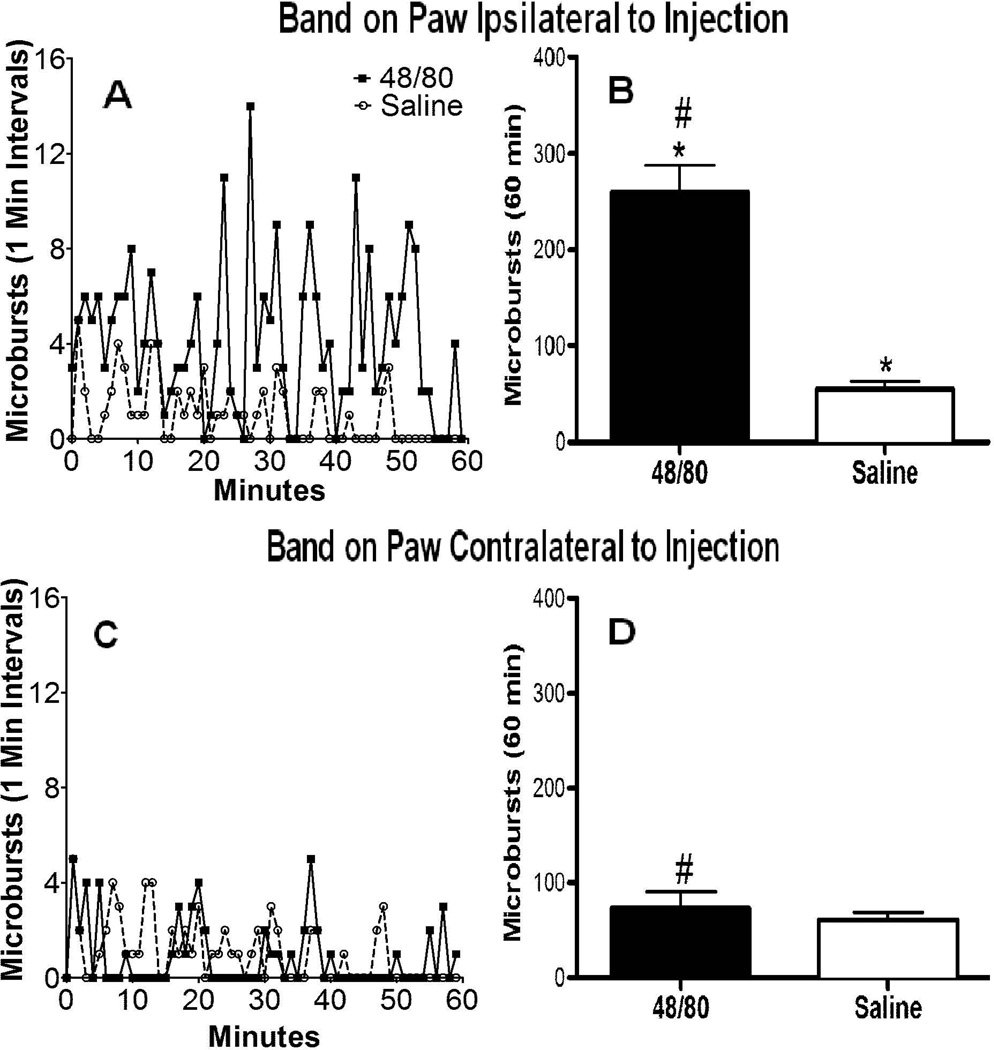
Figure 4.
A: PMD microburst counts plotted vs. time after injection of 48/80 (0.5 mg/mL) or saline into single mice with the detection band ipsilateral to the injection site. (N=1 for both as representatives of the mean) B: Cumulative microburst counts (mean ± SEM) over 1 hr after the SQ injection of 48/80 (N=5) or saline (N=5). C: Same as A except detection band was placed on contralateral hind paw. D: Same as B, except detection band was placed on contralateral hind paw (n=4) 2-tailed t-test: * p<0.01 48/80 ipsilateral vs. saline; 2-tailed t-test # p<0.001 48/80 ipsilateral vs. 48/80 contralateral. The difference between saline and 48/80 contralateral was not statistically significant p=0.51.

