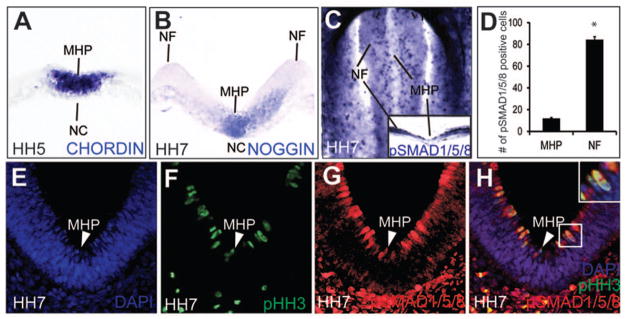
Figure 1. BMP signaling in the folding neural plate.
(A) Chordin expression in the NC and the prospective MHP. (B) Noggin expression in the NC and the MHP. (C–H) A 2-dimensional pSMAD 1,5,8 gradient in the neural plate. (C, D) HH7 wholemount (top-down view, rostral to the top) showing a mosaic, latero-medial pSMAD 1,5, 8 gradient, with the low levels of pSMAD 1,5,8 at the MHP and higher levels in the neural folds (NF). Distribution of pSMAD 1,5,8+ cells along the lateral-medial axis is quantitated in D (# of lateral cells: 84.4; # of medial cells: 12; p=3.84×10⁻⁶.) (E-H). Cross-sectional views displaying latero-medially and apicobasally graded pSMAD 1,5, 8 expression (red) and its apical colocalization with mitotic (pHH3+, green) cells (arrowhead, E–H; boxed cell, H).

