
Fig. 1. Quantitative assessment of myenteric neurons.
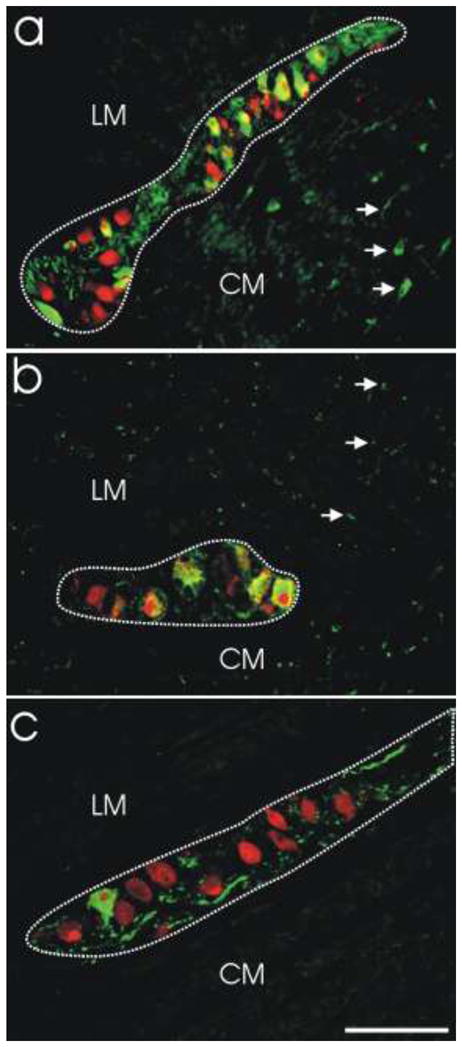
Absolute numbers (neurons/mm2) and relative proportions of myenteric neuron phenotypes were assessed using double-label immunofluorescence. a. Myenteric ganglion from colon demonstrating double-label immunofluorescence for NOS (green) and HuC/D (red). Double-labeled NOS-positive neurons are yellow/orange. NOS-negative neurons (HuC/D only) are red. NOS-positive processes are green (arrows). b. Myenteric ganglion from stomach demonstrating double-label immunofluorescence for VIP (green) and HuC/D (red). Double-labeled VIP-positive neurons are yellow/orange. VIP-negative neurons (HuC/D only) are red. VIP-positive processes are green (arrows). c. Myenteric ganglion from stomach demonstrating double-label immunofluorescence for TH (green) and HuC/D (red). Double-labeled TH-positive neurons are yellow/orange. TH-negative neurons (HuC/D only) are red. TH-positive processes are green. Dotted lines outline ganglion area. LM, longitudinal muscle layer; CM, circular muscle layer. Scale bar = 100 μm