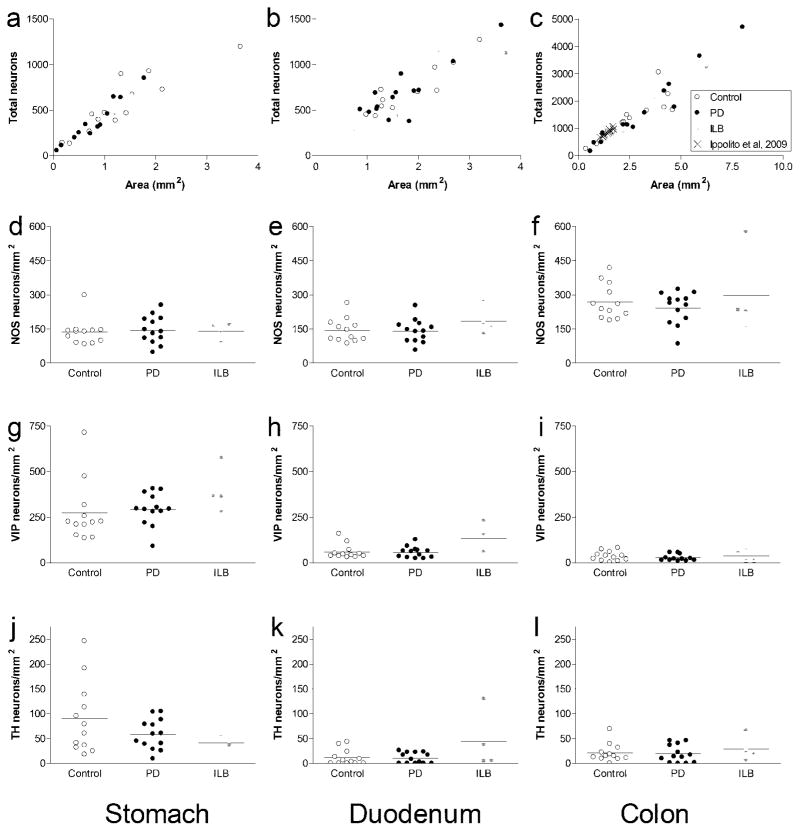
Fig. 2. Numbers of myenteric neurons (per mm2 ganglion area) in stomach, duodenum, and colon.
a-c. Scatter plots of total neurons (HuD-positive) counted per mm2 from all cases for (a) stomach (R2 = 0.84), (b) duodenum (R2 = 0.77), and (c) colon (R2 = 0.90). d–f. Dot plots of NOS neurons counted per mm2 for (d) stomach, (e) duodenum, and (f) colon. g–i. Dot plots of VIP neurons counted per mm2 for (g) stomach, (h) duodenum, and (i) colon. j–l. Dot plots of TH neurons counted per mm2 for (j) stomach, (k) duodenum, and (l) colon

