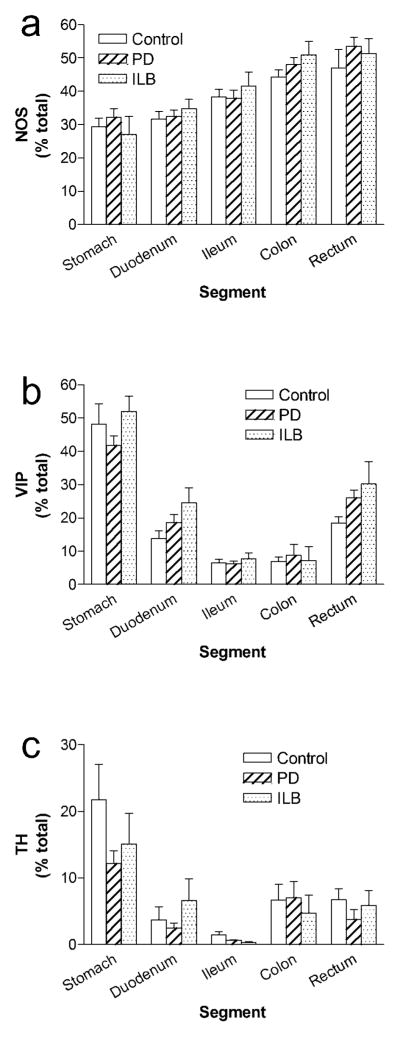
Fig. 4. Relative proportions of major myenteric neuron subtypes in PD and ILB.
a. NOS b. VIP c. TH. Bars are mean ± SEM from 12 control individuals, 13 PD patients, and 4 ILB patients. There is no difference in the proportion of any neurochemical phenotype between controls and patients in any segment. The relative proportions of individual neurochemical subtypes vary based on GI tract segment

