
Figure 8. Measurement of a four-site phosphoryl-form distribution.
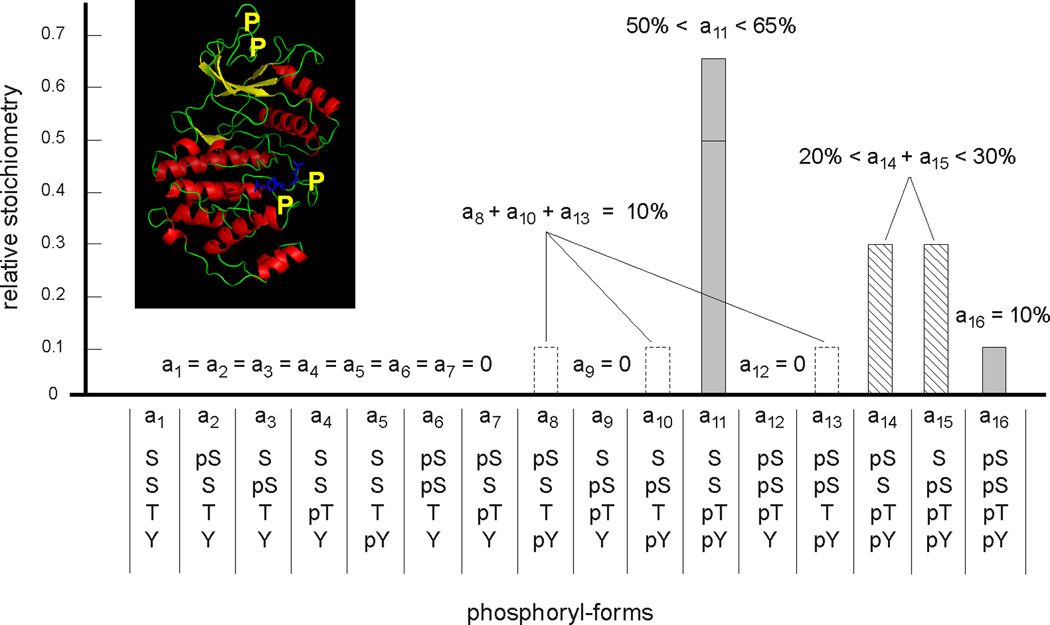
The phosphoryl-form distribution of the MAP kinase Erk2 is shown, after in-vitro preparation to generate four sites of phosphorylation, two canonical ones, Thr and Tyr, on the activation loop and two novel ones, both Ser, on the N-terminal tail. Their approximate positions are marked by yellow Ps on the ribbon diagram of PDB-2ERK in the inset. Note, in particular, that these residues are not all on the same tryptic peptide. A combination of peptide-based and protein-based mass spectrometry, confirmed by nuclear magnetic resonance spectroscopy, was used to measure the relative stoichiometry of the sixteen potential phosphoryl-forms, not all of which could be individually determined. Adapted from Figure 6B of (90), with the inset created in Open Source PyMol 1.2.X.