Fig. 4.

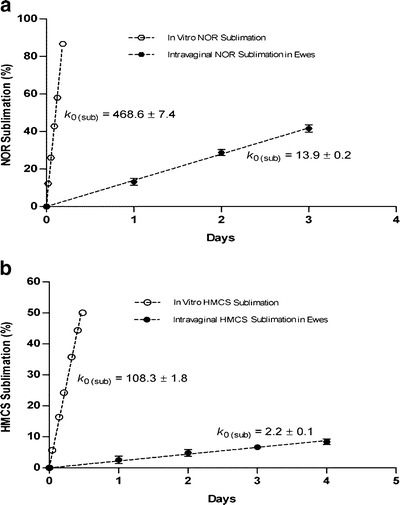
Comparison of intravaginal sublimation rates in ewes for (a) NOR and (b) HMCS matrices relative to “accelerated” rates obtained in vitro under controlled convection conditions. Each plotted point represents a mean ± SEM (N = 4).

Comparison of intravaginal sublimation rates in ewes for (a) NOR and (b) HMCS matrices relative to “accelerated” rates obtained in vitro under controlled convection conditions. Each plotted point represents a mean ± SEM (N = 4).