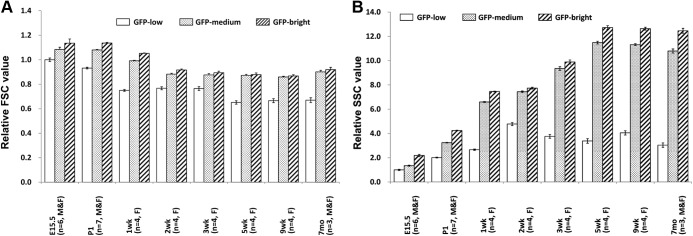
Fig. 5.
Flow cytometry analysis for cell size and granularity of GFP-low, -medium, and -bright cells over time. A, Cell size of GFP-low, -medium, and -bright cells estimated by FSC. The FSC value of GFP-low at E15.5 is defined as 1. B, Granularity of GFP-low, -medium, and -bright cells estimated by SSC. SSC value of GFP-low at E15.5 is defined as 1. White, dotted, and striped bars represent GFP-low, -medium, and -bright populations, respectively. F, Female; M, male. Bars represent mean ± se.

