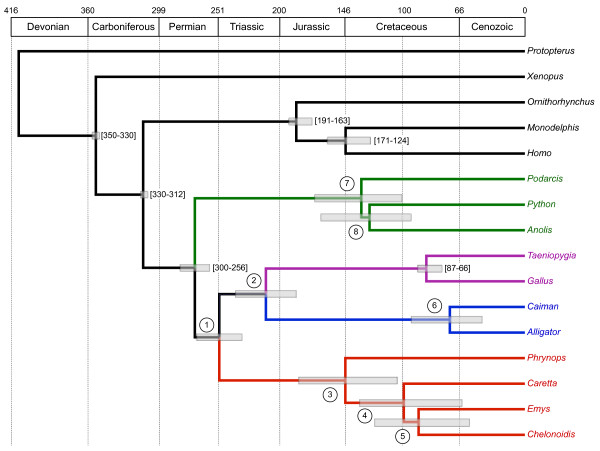
Figure 4.
Bayesian relaxed molecular clock time scale. Chronogram obtained from the analysis of the nucleotide dataset using the CAT-GTR + G mixture model. Numbers in circles at nodes refer to lines of Table 3, and squared boxes represent 95% credibility intervals. Numbers between brackets represent the six calibration constraints implemented as soft bounds. Absolute ages of the geological periods follow Gradstein and Hogg [91].

