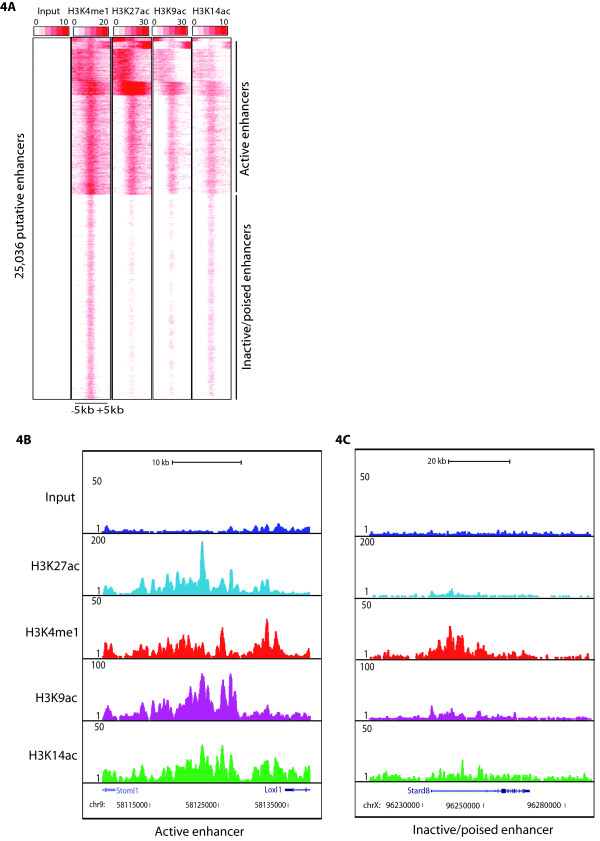
Figure 4.
H3K9ac and H3K14ac mark active enhancers along with H3K27ac. (A) Heatmap of the signal density using k-means clustering observed on 25036 putative enhancers (-/+ 5 kb) from mES cells for H3K4me1 (mark of putative enhancers), H3K27ac, H3K9ac and H3K14ac. On the basis of presence or absence of H3K27ac enhancers are categorized as active or poised/inactive. UCSC genome browser track of representative examples of (B) active enhancer and (C) poised/inactive enhancer. Active enhancers have significant enrichment of H3K9ac and H3K14ac as compared to poised/inactive enhancers as was observed for H3K27ac.

